


Next 24 hours: Currencies get a little relief against Buck
Today’s report: In between event risks
At the moment, it feels like we’re in a bit of a calm between event risks. The market has now taken in the reality of an ongoing hawkish Fed trajectory in the aftermath of this week’s Fed Chair Powell testimony, and is now looking ahead to Friday’s BOJ decision and US jobs report.
Wake-up call
- ECB Visco
- BOE Dhingra
- final meeting
- China CPI
- BoC pause
- improved sentiment
- Inflation headache
- Dealers report
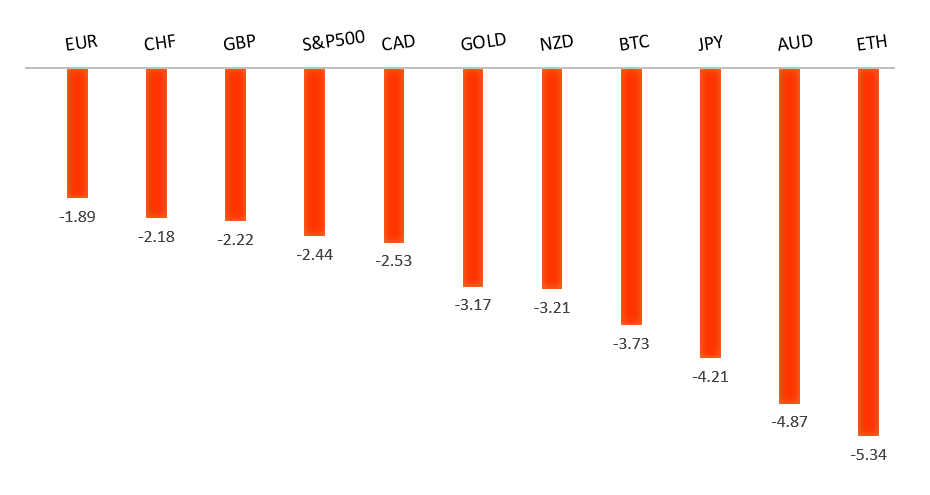
Peformance chart: 30 Day Performance vs. US dollar (%)
Suggested reading
- Has a Recession Been Postponed? Jobs Data May Tell, J. Authers, Bloomberg (March 9, 2023)
- A One-Stop Investment Shop for the Global Elite, S. Indap, Morningstar (March 9, 2023)
Chart talk: Technical & fundamental highlights
Choose pair:
EURUSD – technical overview
The Euro is in the throes of a correction following a run to the topside through 1.1000 earlier this year. Any additional setbacks should be well supported ahead of 1.0200 in favor of the formation of the next major higher low and a bullish continuation. Ultimately, only a monthly close back below parity would give reason for concern.EURUSD – fundamental overview
The Euro has been trading with a heavier tone as cracks appear in the hawkish ECB communications. ECB Visco was out saying he didn't appreciate colleagues' statements on future and prolonged increases in interest rates. Meanwhile, Eurozone GDP was revised lower and German retail sales came in soft. Looking ahead, the only notable standout on the calendar comes from US initial jobless claims.EURUSD - Technical charts in detail
GBPUSD – technical overview
Signs have emerged of the market wanting to put in a longer-term base after collapsing to a record low in September 2022. The recent weekly close back above the September high at 1.1739 strengthens this prospect. Any setbacks should now be well supported ahead of 1.1500. Next key resistance comes in at 1.2668.GBPUSD – fundamental overview
The Pound remained weighed down, this time on dovish BOE Dhingra comments that prior rate hikes had not yet been felt, while also warning of overtightening. Looking ahead, the only notable standout on the calendar comes from US initial jobless claims.USDJPY – technical overview
The major pair has seen a nice recovery following the massive correction out from multi-year highs. Setbacks have finally been well supported ahead of 125.00 in the 127s thus far. At this stage, it looks like the market could be wanting to resume the bigger picture uptrend and head back towards a retest of that multi-year high from October 2022 up at 151.95. Look for any weakness to continue to be well supported in favor of higher lows along the way.USDJPY – fundamental overview
Yield differentials have widened further in the US Dollar's favor this week, mostly on the back of the Fed Chair's hawkish testimony. The BOJ will meet tomorrow, though no change is expected to policy in what will be Kuroda's final meeting. Looking ahead, the only notable standout on the calendar comes from US initial jobless claims.AUDUSD – technical overview
There are signs of the potential formation of a longer-term base following the late 2022 surge back above 0.6500. The recent weekly close back above previous support now turned resistance at 0.6682 strengthens the outlook for a bullish structural shift. Next key resistance comes in at 0.7284. Setbacks should be well supported ahead of 0.6500.AUDUSD – fundamental overview
The Australian Dollar is trying to put in a recovery on Thursday, seemingly on the back of the softer inflation data out of China which should serve well for risk correlated assets. Looking ahead, the only notable standout on the calendar comes from US initial jobless claims.USDCAD – technical overview
A recent surge back above 1.3000 signals an end to a period of bearish consolidation and suggests the market is in the process of carving out a more significant longer-term base. Next key resistance now comes in up into the 1.4000 area. Setbacks should be very well supported down into the 1.3000 area.USDCAD – fundamental overview
The Canadian Dollar extended its run of declines after the Bank of Canada paused on rate hikes after nine consecutive hikes. The central bank also forecast CPI to decline to 3% by the middle of 2023, while seeing near-zero GDP growth through Q3. Looking ahead, the only notable standout on the calendar comes from US initial jobless claims.NZDUSD – technical overview
Overall pressure remains on the downside with the market once again stalling out on a run up into the 0.6500 area. Ultimately, a break back above 0.6577 would be required to take the immediate pressure off the downside.NZDUSD – fundamental overview
The New Zealand Dollar is trying to put in a recovery on Thursday, seemingly on the back of the softer inflation data out of China which should serve well for risk correlated assets. Looking ahead, the only notable standout on the calendar comes from US initial jobless claims.US SPX 500 – technical overview
Longer-term technical studies are in the process of unwinding from extended readings off record highs. Look for rallies to be well capped in favor of lower tops and lower lows. A monthly close back above 4300 will be required at a minimum to take the immediate pressure off the downside. Next major support comes in at 3885.US SPX 500 – fundamental overview
We've finally reached a point in the cycle where the Fed recognizes unanchored inflation expectations pose a greater downside risk than over-tightening. This is significant, as it means less investor friendly monetary policy that risks potential recession in the months ahead. Overall, we expect inflation to continue to be a problem in H1 2023 that results in downside pressure into rallies.GOLD (SPOT) – technical overview
The 2019 breakout above the 2016 high at 1375 was a significant development, opening the door for fresh record highs. Setbacks should now be well supported above 1600 on a monthly close basis ahead of the next major upside extension. The recent break back above 1808 strengthens the bullish outlook. Next major resistance comes in at 2000.GOLD (SPOT) – fundamental overview
The yellow metal continues to be well supported on dips with solid demand from medium and longer-term accounts. These players are more concerned about inflation risk and a less upbeat global growth outlook. All of this should keep the commodity well supported, with many market participants also fleeing to the hard asset as the grand dichotomy of record high equities and record low yields comes to an unnerving climax.