


Next 24 hours: Realities that can't be ignored
Today’s report: Investors can't get away from inflation risk
US rates were up for the fifth consecutive day on Wednesday and the US Dollar was able to rally as a consequence. The market has been forced to have a serious rethink about how it has been pricing the path forward with respect to monetary policy.
Wake-up call
- ECB Minutes
- UK inflation
- easy policy
- leading index
- Housing starts
- inflation data
- Inflation headache
- Dealers report
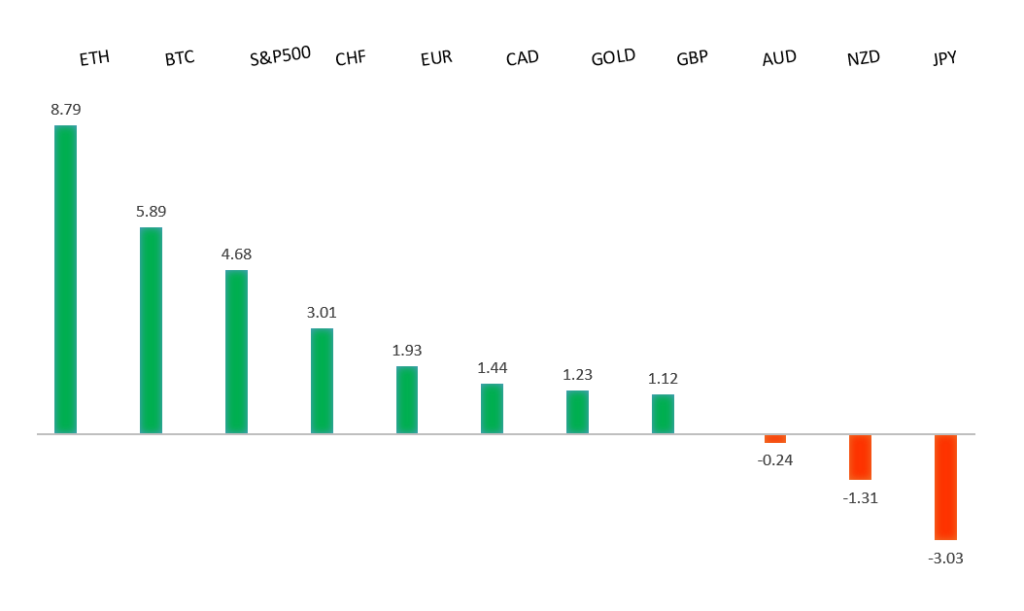
Peformance chart: 30 Day Performance vs. US dollar (%)
Suggested reading
- Joyride Is Nearly Over for Auto Parts Stocks, J. Authers, Bloomberg (April 19, 2023)
- Why 3D printing is vital to success of US manufacturing, R. Foroohar, Financial Times (April 19, 2023)
Chart talk: Technical & fundamental highlights
Choose pair:
EURUSD – technical overview
The Euro remains well supported on dips following a run to the topside through 1.1000 earlier this year. Any additional setbacks should be well supported ahead of 1.0500 in favor of the formation of the next major higher low and a bullish continuation. Ultimately, only a monthly close back below 1.0500 would give reason for concern. Next key resistance comes in the form of the March 2022 high at 1.1185.EURUSD – fundamental overview
Eurozone core inflation was confirmed at a record high, while ECB Lane was on the wires saying a May rate hike was likely. Nevertheless, the demand for Dollars was greater, which ultimately weighed on the Euro. Key standouts on Thursday’s calendar come from German producer prices, Eurozone trade, the ECB Minutes, the US Philly Fed, initial jobless claims, and existing home sales, and Eurozone consumer confidence. We also get a wave of ECB and Fed speak.EURUSD - Technical charts in detail
GBPUSD – technical overview
Signs have emerged of the market wanting to put in a longer-term base after collapsing to a record low in September 2022. The November 2022 monthly close back above 1.2000 strengthens this prospect. Any setbacks should now be well supported ahead of 1.2000. Next key resistance comes in at 1.2667.GBPUSD – fundamental overview
UK inflation continued to trend up above expectation, which has led to GBP outperformance in recent sessions as it increases odds for a more aggressive move from the BOE. Key standouts on Thursday’s calendar come from German producer prices, Eurozone trade, the ECB Minutes, the US Philly Fed, initial jobless claims, and existing home sales, and Eurozone consumer confidence. We also get a wave of ECB and Fed speak.USDJPY – technical overview
The major pair has seen a nice recovery following the massive correction out from multi-year highs. Setbacks have finally been well supported ahead of 125.00 in the 127s thus far. At this stage, it looks like the market could be wanting to resume the bigger picture uptrend and head back towards a retest of that multi-year high from October 2022 up at 151.95. Look for any weakness to continue to be well supported in favor of higher lows along the way.USDJPY – fundamental overview
The BOJ has continued to keep with an easy policy line, adding that it would be wary to make any changes to policy this month. Key standouts on Thursday’s calendar come from German producer prices, Eurozone trade, the ECB Minutes, the US Philly Fed, initial jobless claims, and existing home sales, and Eurozone consumer confidence. We also get a wave of ECB and Fed speak.AUDUSD – technical overview
There are signs of the potential formation of a longer-term base following the late 2022 surge back above 0.6500. The recent weekly close back above previous support now turned resistance at 0.6682 strengthens the outlook for a bullish structural shift. Next key resistance comes in at 0.7284. Setbacks should be well supported ahead of 0.6500.AUDUSD – fundamental overview
The Australian Westpac leading index came out less bad than expected the other day, and overall, the Australian Dollar has held up rather well in the fact of some risk off flow. Key standouts on Thursday’s calendar come from German producer prices, Eurozone trade, the ECB Minutes, the US Philly Fed, initial jobless claims, and existing home sales, and Eurozone consumer confidence. We also get a wave of ECB and Fed speak.USDCAD – technical overview
A recent surge back above 1.3000 signals an end to a period of bearish consolidation and suggests the market is in the process of carving out a more significant longer-term base. Next key resistance now comes in up into the 1.4000 area. Setbacks should be very well supported down into the 1.3000 area.USDCAD – fundamental overview
The Canadian Dollar has been a standout underperformer this week on the back of softer Canada inflation reads and weaker economic data as reflected by the latest discouraging housing starts print. Key standouts on Thursday’s calendar come from German producer prices, Eurozone trade, the ECB Minutes, the US Philly Fed, initial jobless claims, and existing home sales, and Eurozone consumer confidence. We also get a wave of ECB and Fed speak.NZDUSD – technical overview
Overall pressure remains on the downside with the market once again stalling out on a run up into the 0.6500 area. Ultimately, a break back above 0.6577 would be required to take the immediate pressure off the downside.NZDUSD – fundamental overview
No surprise to see the New Zealand Dollar trading lower on Thursday after the latest round of inflation data came in a good deal softer than expected. This has opened a dovish repricing of RBNZ expectations. Key standouts on Thursday’s calendar come from German producer prices, Eurozone trade, the ECB Minutes, the US Philly Fed, initial jobless claims, and existing home sales, and Eurozone consumer confidence. We also get a wave of ECB and Fed speak.US SPX 500 – technical overview
Longer-term technical studies are in the process of unwinding from extended readings off record highs. Look for rallies to be well capped in favor of lower tops and lower lows. A monthly close back above 4300 will be required at a minimum to take the immediate pressure off the downside. Next major support comes in at 3806.US SPX 500 – fundamental overview
We've finally reached a point in the cycle where the Fed recognizes unanchored inflation expectations pose a greater downside risk than over-tightening. This is significant, as it means less investor friendly monetary policy that risks potential recession in the months ahead. Overall, we expect inflation to continue to be a problem in H1 2023 that results in downside pressure into rallies.GOLD (SPOT) – technical overview
The 2019 breakout above the 2016 high at 1375 was a significant development, opening the door for fresh record highs. Setbacks should now be well supported above 1600 on a monthly close basis ahead of the next major upside extension. The recent break back above 1808 strengthens the bullish outlook. Next major resistance comes in at the record high from 2020 at 2076, above which opens the next extension towards 2,500.GOLD (SPOT) – fundamental overview
The yellow metal continues to be well supported on dips with solid demand from medium and longer-term accounts. These players are more concerned about inflation risk and a less upbeat global growth outlook. All of this should keep the commodity well supported, with many market participants also fleeing to the hard asset as the grand dichotomy of record high equities and record low yields comes to an unnerving climax.