


Next 24 hours: Calendar heats up into end of week
Today’s report: Between a rock and a hard place
The market is caught between a rock and a hard place right now. On the one side, it wants to feel good about corporate earnings beats from the likes of Alphabet and Microsoft. On the other hand, its having a hard time getting away from ongoing worry around ongoing vulnerability in the banking sector.
Wake-up call
- policy distinction
- UK CBI
- YCC anticipation
- Aussie inflation
- Commodities stabilize
- RBNZ repricing
- Inflation headache
- Dealers report
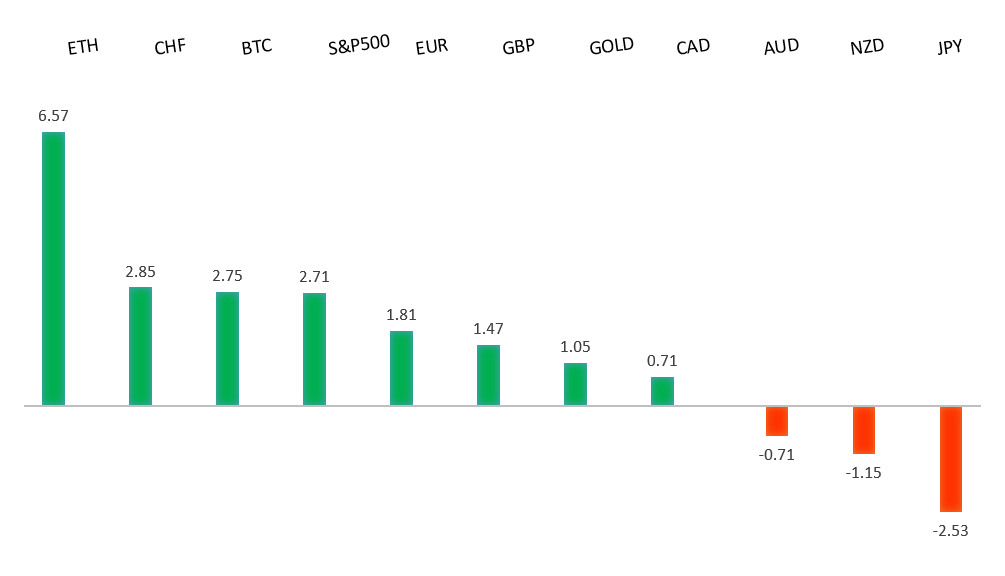
Peformance chart: 30 Day Performance vs. US dollar (%)
Suggested reading
- Inflation Is Thriving in Our Era’s Lack of Trust, J. Authers, Bloomberg (April 27, 2023)
- Would Investors Be Smart To Move Portfolios To Cash Now?, P. Katzeff, Financial Times (April 25, 2023)
Chart talk: Technical & fundamental highlights
Choose pair:
EURUSD – technical overview
The Euro remains well supported on dips following a run to the topside through 1.1000 earlier this year. Any additional setbacks should be well supported ahead of 1.0500 in favor of the formation of the next major higher low and a bullish continuation. Ultimately, only a monthly close back below 1.0500 would give reason for concern. Next key resistance comes in the form of the March 2022 high at 1.1185.EURUSD – fundamental overview
The Euro has run up to a fresh 2023 high as the ECB draws a clear policy distinction. ECB Guindos was on the wires seeing Europe avoiding a recession, while calling core inflation sticky. Key standouts on Thursday’s calendar include Eurozone sentiment and consumer confidence reads, and US releases in the form of GDP, initial jobless claims, and pending home sales.EURUSD - Technical charts in detail
GBPUSD – technical overview
Signs have emerged of the market wanting to put in a longer-term base after collapsing to a record low in September 2022. The November 2022 monthly close back above 1.2000 strengthens this prospect. Any setbacks should now be well supported ahead of 1.2000. Next key resistance comes in at 1.2667.GBPUSD – fundamental overview
The latest CBI numbers were supportive which have helped to fuel additional demand for the Pound. Key standouts on Thursday’s calendar include Eurozone sentiment and consumer confidence reads, and US releases in the form of GDP, initial jobless claims, and pending home sales.USDJPY – technical overview
The major pair has seen a nice recovery following the massive correction out from multi-year highs. Setbacks have finally been well supported ahead of 125.00 in the 127s thus far. At this stage, it looks like the market could be wanting to resume the bigger picture uptrend and head back towards a retest of that multi-year high from October 2022 up at 151.95. Look for any weakness to continue to be well supported in favor of higher lows along the way.USDJPY – fundamental overview
The Yen has found some renewed demand in recent sessions, perhaps on broad based risk off flow, or perhaps on reports of repatriation as investors prepare for a BOJ yield curve control shift. More color will be offered later this week when the BOJ meets. Key standouts on Thursday’s calendar include Eurozone sentiment and consumer confidence reads, and US releases in the form of GDP, initial jobless claims, and pending home sales.AUDUSD – technical overview
There are signs of the potential formation of a longer-term base following the late 2022 surge back above 0.6500. The recent weekly close back above previous support now turned resistance at 0.6682 strengthens the outlook for a bullish structural shift. Next key resistance comes in at 0.7284. Setbacks should be well supported ahead of 0.6500.AUDUSD – fundamental overview
The Australian Dollar has been hit with a wave of underperformance on the back of the latest softer than expected run of inflation data. Key standouts on Thursday’s calendar include Eurozone sentiment and consumer confidence reads, and US releases in the form of GDP, initial jobless claims, and pending home sales.USDCAD – technical overview
A recent surge back above 1.3000 signals an end to a period of bearish consolidation and suggests the market is in the process of carving out a more significant longer-term base. Next key resistance now comes in up into the 1.4000 area. Setbacks should be very well supported down into the 1.3000 area.USDCAD – fundamental overview
The Canadian Dollar has steadied after a five day losing streak getting help from commodities stabilization and a bump in Canada factory sales. Key standouts on Thursday’s calendar include Eurozone sentiment and consumer confidence reads, and US releases in the form of GDP, initial jobless claims, and pending home sales.NZDUSD – technical overview
Overall pressure remains on the downside with the market once again stalling out on a run up into the 0.6500 area. Ultimately, a break back above 0.6577 would be required to take the immediate pressure off the downside.NZDUSD – fundamental overview
The New Zealand Dollar has found some demand on cross related interest against the Australian Dollar. However, ultimately, the currency continues to get sold into rallies on risk off flow, especially after last week's New Zealand inflation data came in soft to open a dovish repricing of RBNZ expectations. Key standouts on Thursday’s calendar include Eurozone sentiment and consumer confidence reads, and US releases in the form of GDP, initial jobless claims, and pending home sales.US SPX 500 – technical overview
Longer-term technical studies are in the process of unwinding from extended readings off record highs. Look for rallies to be well capped in favor of lower tops and lower lows. A monthly close back above 4300 will be required at a minimum to take the immediate pressure off the downside. Next major support comes in at 3806.US SPX 500 – fundamental overview
We've finally reached a point in the cycle where the Fed recognizes unanchored inflation expectations pose a greater downside risk than over-tightening. This is significant, as it means less investor friendly monetary policy that risks potential recession in the months ahead. Overall, we expect inflation to continue to be a problem in 2023 that results in downside pressure into rallies.GOLD (SPOT) – technical overview
The 2019 breakout above the 2016 high at 1375 was a significant development, opening the door for fresh record highs. Setbacks should now be well supported above 1600 on a monthly close basis ahead of the next major upside extension. The recent break back above 1808 strengthens the bullish outlook. Next major resistance comes in at the record high from 2020 at 2076, above which opens the next extension towards 2,500.GOLD (SPOT) – fundamental overview
The yellow metal continues to be well supported on dips with solid demand from medium and longer-term accounts. These players are more concerned about inflation risk and a less upbeat global growth outlook. All of this should keep the commodity well supported, with many market participants also fleeing to the hard asset as the grand dichotomy of record high equities and record low yields comes to an unnerving climax.