


Next 24 hours: Australian Dollar shines in Tuesday trade
Today’s report: Europe returns from long holiday weekend
We get back to fuller market conditions on this Tuesday as Europeans return to their desks following the May Day holiday long weekend. As we look out there at the state of markets, it’s the Yen and Australian Dollar that stand out on the currency front.
Wake-up call
- policy decisions
- holiday weekend
- BOJ policy
- surprise hike
- Oil selling
- correlation
- Inflation headache
- Dealers report
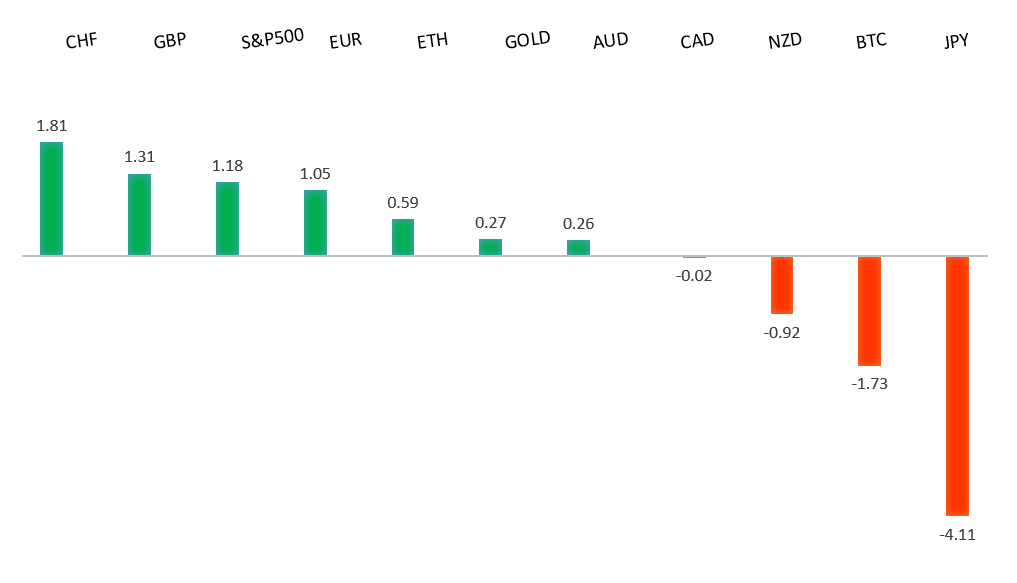
Peformance chart: 30 Day Performance vs. US dollar (%)
Suggested reading
- The Sun the Banking World Revolves Around, J. Authers, Bloomberg (May 2, 2023)
- Soaring Profits Put Oil and Gas 'SuperMajors' in Spotlight, S. Mundy, Financial Times (May 2, 2023)
Chart talk: Technical & fundamental highlights
Choose pair:
EURUSD – technical overview
The Euro remains well supported on dips following a run to the topside through 1.1000 earlier this year. Any additional setbacks should be well supported ahead of 1.0500 in favor of the formation of the next major higher low and a bullish continuation. Ultimately, only a monthly close back below 1.0500 would give reason for concern. Next key resistance comes in the form of the March 2022 high at 1.1185.EURUSD – fundamental overview
There wasn't much activity in Monday trade on account of the May Day holiday closures. Most of the focus now shifts to upcoming policy decisions from the Fed and ECB. Looking ahead to today, key standouts on the calendar come from German retail sales, some German and Eurozone manufacturing PMI reads, UK manufacturing PMIs, Eurozone inflation, US JOLTs job openings, and factory orders.EURUSD - Technical charts in detail
GBPUSD – technical overview
Signs have emerged of the market wanting to put in a longer-term base after collapsing to a record low in September 2022. The November 2022 monthly close back above 1.2000 strengthens this prospect. Any setbacks should now be well supported ahead of 1.2000. Next key resistance comes in at 1.2667.GBPUSD – fundamental overview
UK markets were closed on Monday for the May Day holiday and will be getting back to fuller form today. Looking ahead, key standouts on the calendar come from German retail sales, some German and Eurozone manufacturing PMI reads, UK manufacturing PMIs, Eurozone inflation, US JOLTs job openings, and factory orders.USDJPY – technical overview
The major pair has seen a nice recovery following the massive correction out from multi-year highs. Setbacks have finally been well supported ahead of 125.00 in the 127s thus far. At this stage, it looks like the market could be wanting to resume the bigger picture uptrend and head back towards a retest of that multi-year high from October 2022 up at 151.95. Look for any weakness to continue to be well supported in favor of higher lows along the way.USDJPY – fundamental overview
The Yen has come under intense pressure in the aftermath of last week's BOJ decision which disappointed many hawks out there. The central bank kept to form, leaving current negative interest rate policy and yield curve controls in place. Looking ahead, key standouts on the calendar come from German retail sales, some German and Eurozone manufacturing PMI reads, UK manufacturing PMIs, Eurozone inflation, US JOLTs job openings, and factory orders.AUDUSD – technical overview
There are signs of the potential formation of a longer-term base following the late 2022 surge back above 0.6500. The recent weekly close back above previous support now turned resistance at 0.6682 strengthens the outlook for a bullish structural shift. Next key resistance comes in at 0.7284. Setbacks should be well supported ahead of 0.6500.AUDUSD – fundamental overview
The RBA came out with a surprise decision earlier today, opting to raise rates by 25 basis points after most of the market though the central bank would hold. RBA Lowe was also on the wires flagging the possibility for additional hikes in the coming months. All of this has factored into the run of Aussie outperformance we're seeing on this Tuesday. Looking ahead, key standouts on the calendar come from German retail sales, some German and Eurozone manufacturing PMI reads, UK manufacturing PMIs, Eurozone inflation, US JOLTs job openings, and factory orders.USDCAD – technical overview
A recent surge back above 1.3000 signals an end to a period of bearish consolidation and suggests the market is in the process of carving out a more significant longer-term base. Next key resistance now comes in up into the 1.4000 area. Setbacks should be very well supported down into the 1.3000 area.USDCAD – fundamental overview
Canadian Dollar gains slowed down on Monday, with most of this attributed to renewed selling in the price of oil. Looking ahead, key standouts on the calendar come from German retail sales, some German and Eurozone manufacturing PMI reads, UK manufacturing PMIs, Eurozone inflation, US JOLTs job openings, and factory orders.NZDUSD – technical overview
Overall pressure remains on the downside with the market once again stalling out on a run up into the 0.6500 area. Ultimately, a break back above 0.6577 would be required to take the immediate pressure off the downside.NZDUSD – fundamental overview
The New Zealand Dollar has been getting a boost on Tuesday as it trades alongside its Aussie cousin, benefitting from the momentum from the RBA rate hike. Looking ahead, key standouts on the calendar come from German retail sales, some German and Eurozone manufacturing PMI reads, UK manufacturing PMIs, Eurozone inflation, US JOLTs job openings, and factory orders.US SPX 500 – technical overview
Longer-term technical studies are in the process of unwinding from extended readings off record highs. Look for rallies to be well capped in favor of lower tops and lower lows. A monthly close back above 4300 will be required at a minimum to take the immediate pressure off the downside. Next major support comes in at 3806.US SPX 500 – fundamental overview
We've finally reached a point in the cycle where the Fed recognizes unanchored inflation expectations pose a greater downside risk than over-tightening. This is significant, as it means less investor friendly monetary policy that risks potential recession in the months ahead. Overall, we expect inflation to continue to be a problem in 2023 that results in downside pressure into rallies.GOLD (SPOT) – technical overview
The 2019 breakout above the 2016 high at 1375 was a significant development, opening the door for fresh record highs. Setbacks should now be well supported above 1600 on a monthly close basis ahead of the next major upside extension. The recent break back above 1808 strengthens the bullish outlook. Next major resistance comes in at the record high from 2020 at 2076, above which opens the next extension towards 2,500.GOLD (SPOT) – fundamental overview
The yellow metal continues to be well supported on dips with solid demand from medium and longer-term accounts. These players are more concerned about inflation risk and a less upbeat global growth outlook. All of this should keep the commodity well supported, with many market participants also fleeing to the hard asset as the grand dichotomy of record high equities and record low yields comes to an unnerving climax.