


Special report: FOMC Policy Decision Preview
Today’s report: Market sentiment heads south
Things are looking shaky out there as we come into Wednesday. Turmoil in the banking sector and stress around the US debt ceiling deadline have intensified investor concerns and the resulting price action has seen both stocks and the US Dollar trading lower.
Wake-up call
- hot inflation
- good data
- safety bid
- retail sales
- Oil collapse
- employment, wages
- Inflation headache
- Dealers report
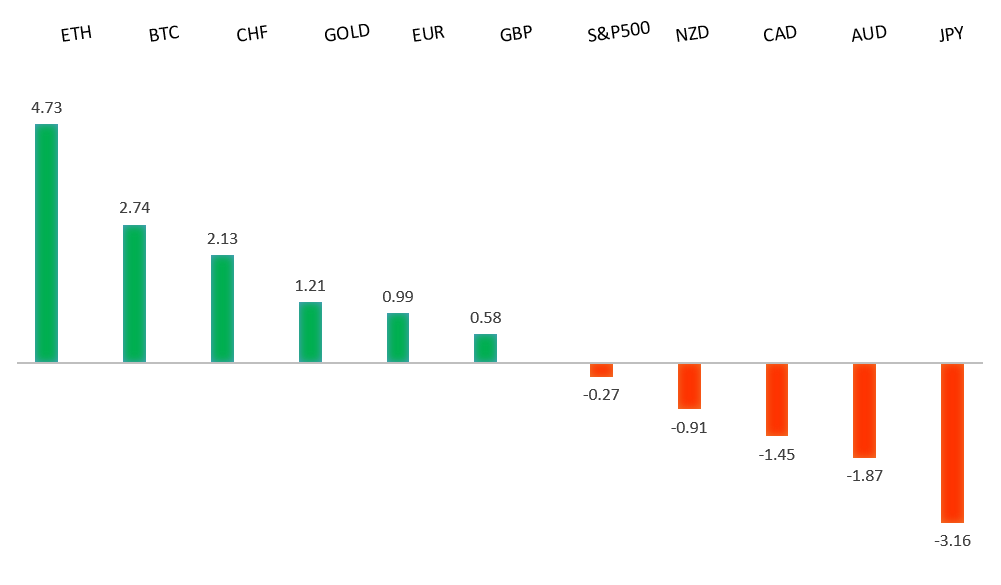
Peformance chart: 30 Day Performance vs. US dollar (%)
Suggested reading
- Little Fires in Banks Will Give Fed Something Else to Discuss, J. Authers, Bloomberg (May 3, 2023)
- Soaring Profits Put Oil and Gas 'SuperMajors' in Spotlight, S. Mundy, Financial Times (May 2, 2023)
Chart talk: Technical & fundamental highlights
Choose pair:
EURUSD – technical overview
The Euro remains well supported on dips following a run to the topside through 1.1000 earlier this year. Any additional setbacks should be well supported ahead of 1.0500 in favor of the formation of the next major higher low and a bullish continuation. Ultimately, only a monthly close back below 1.0500 would give reason for concern. Next key resistance comes in the form of the March 2022 high at 1.1185.EURUSD – fundamental overview
German retail sales data missed badly the other day, which factored into some initial downside price action. However, the Euro was able to recover on the back of hot Eurozone inflation data and softer US jobs reads. Key standouts on today’s calendar come from Eurozone unemployment, US ADP employment, US ISM reads, and the Fed decision late in the day.EURUSD - Technical charts in detail
GBPUSD – technical overview
Signs have emerged of the market wanting to put in a longer-term base after collapsing to a record low in September 2022. The November 2022 monthly close back above 1.2000 strengthens this prospect. Any setbacks should now be well supported ahead of 1.2000. Next key resistance comes in at 1.2667.GBPUSD – fundamental overview
UK Nationwide house prices improved along with UK manufacturing PMIs, though this wasn't enough to help the Pound on Tuesday. Key standouts on today’s calendar come from Eurozone unemployment, US ADP employment, US ISM reads, and the Fed decision late in the day.USDJPY – technical overview
The major pair has seen a nice recovery following the massive correction out from multi-year highs. Setbacks have finally been well supported ahead of 125.00 in the 127s thus far. At this stage, it looks like the market could be wanting to resume the bigger picture uptrend and head back towards a retest of that multi-year high from October 2022 up at 151.95. Look for any weakness to continue to be well supported in favor of higher lows along the way.USDJPY – fundamental overview
While we haven't seen much of the older traditional inverse correlation, this wasn't the case on Tuesday. The Yen was well in demand on the back of a massive liquidation in US equities. Key standouts on today’s calendar come from Eurozone unemployment, US ADP employment, US ISM reads, and the Fed decision late in the day.AUDUSD – technical overview
There are signs of the potential formation of a longer-term base following the late 2022 surge back above 0.6500. The recent weekly close back above previous support now turned resistance at 0.6682 strengthens the outlook for a bullish structural shift. Next key resistance comes in at 0.7284. Setbacks should be well supported ahead of 0.6500.AUDUSD – fundamental overview
The Australian Dollar has been a standout outperformer in recent sessions. The currency has been finding demand in the aftermath of a surprise 25 basis point rate hike from the RBA and today's better than expected Aussie retail sales print. All of this comes despite a wave of risk off flow in global markets. Key standouts on today’s calendar come from Eurozone unemployment, US ADP employment, US ISM reads, and the Fed decision late in the day.USDCAD – technical overview
A recent surge back above 1.3000 signals an end to a period of bearish consolidation and suggests the market is in the process of carving out a more significant longer-term base. Next key resistance now comes in up into the 1.4000 area. Setbacks should be very well supported down into the 1.3000 area.USDCAD – fundamental overview
The Canadian Dollar was hammered in Tuesday trade on the back of a massive pullback in the price of oil and concurrent downturn in US equities. Key standouts on today’s calendar come from Eurozone unemployment, US ADP employment, US ISM reads, and the Fed decision late in the day.NZDUSD – technical overview
Overall pressure remains on the downside with the market once again stalling out on a run up into the 0.6500 area. Ultimately, a break back above 0.6577 would be required to take the immediate pressure off the downside.NZDUSD – fundamental overview
The New Zealand Dollar has been getting an added boost on this Wednesday after employment and wage data came in well above forecast. This shifts RBNZ bets back to the hawkish side and has moved yield differentials back in favor of the New Zealand Dollar. Key standouts on today’s calendar come from Eurozone unemployment, US ADP employment, US ISM reads, and the Fed decision late in the day.US SPX 500 – technical overview
Longer-term technical studies are in the process of unwinding from extended readings off record highs. Look for rallies to be well capped in favor of lower tops and lower lows. A monthly close back above 4300 will be required at a minimum to take the immediate pressure off the downside. Next major support comes in at 3806.US SPX 500 – fundamental overview
We've finally reached a point in the cycle where the Fed recognizes unanchored inflation expectations pose a greater downside risk than over-tightening. This is significant, as it means less investor friendly monetary policy that risks potential recession in the months ahead. Overall, we expect inflation to continue to be a problem in 2023 that results in downside pressure into rallies.GOLD (SPOT) – technical overview
The 2019 breakout above the 2016 high at 1375 was a significant development, opening the door for fresh record highs. Setbacks should now be well supported above 1600 on a monthly close basis ahead of the next major upside extension. The recent break back above 1808 strengthens the bullish outlook. Next major resistance comes in at the record high from 2020 at 2076, above which opens the next extension towards 2,500.GOLD (SPOT) – fundamental overview
The yellow metal continues to be well supported on dips with solid demand from medium and longer-term accounts. These players are more concerned about inflation risk and a less upbeat global growth outlook. All of this should keep the commodity well supported, with many market participants also fleeing to the hard asset as the grand dichotomy of record high equities and record low yields comes to an unnerving climax. [audio mp3="https://www.lmax.com/blog/wp-content/uploads/sites/4/2023/05/3maylmaxaudio.mp3"][/audio]