


Special report: ECB Decision Preview
Today’s report: Fed opens the door to a pause
The Fed decision has come and gone. The net result is a central bank that delivered a 25 basis point hike as expected, while seemingly being more open to the possibility for a pause going forward.
Wake-up call
- ECB decision
- rate hikes
- energy prices
- local fundamentals
- oil bounces
- employment, wages
- Inflation headache
- Dealers report
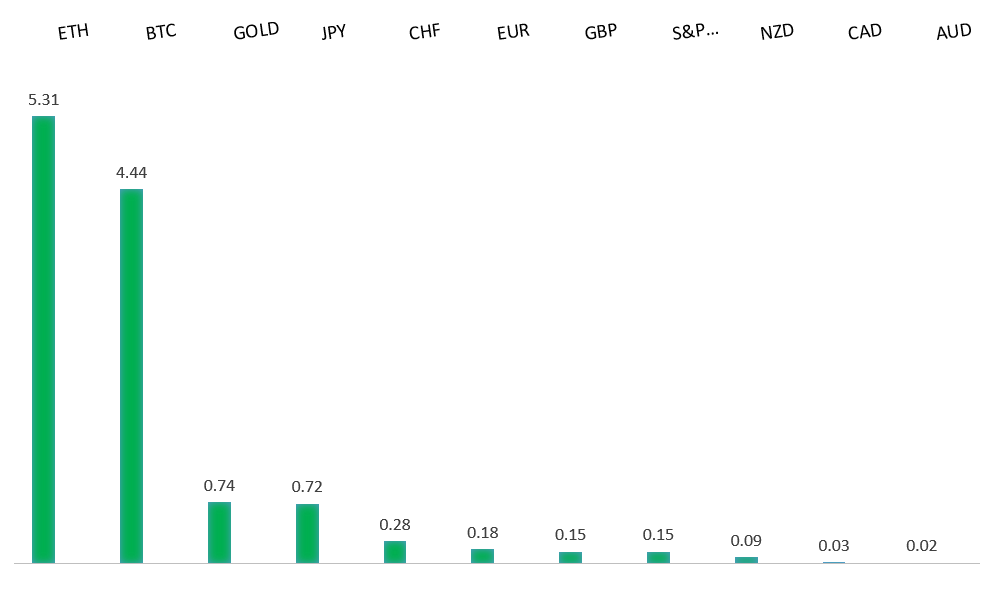
Peformance chart: 30 Day Performance vs. US dollar (%)
Suggested reading
- Powell’s Narrative Revives Talk of a Pivot, J. Authers, Bloomberg (May 4, 2023)
- A Look "Under the Hood" of U.S. Equity Markets, A. Esposito, Real Clear Markets (May 3, 2023)
Chart talk: Technical & fundamental highlights
Choose pair:
EURUSD – technical overview
The Euro remains well supported on dips following a run to the topside through 1.1000 earlier this year. Any additional setbacks should be well supported ahead of 1.0500 in favor of the formation of the next major higher low and a bullish continuation. Ultimately, only a monthly close back below 1.0500 would give reason for concern. Next key resistance comes in the form of the March 2022 high at 1.1185.EURUSD – fundamental overview
The Euro has held up well at yearly high levels, getting another boost from the lower Eurozone unemployment rate. Key standouts on Thursday’s calendar include German trade, PMI reads out of the Eurozone and UK, Eurozone producer prices, the ECB policy decision, Canada trade, US trade, US initial jobless claims, and Canada Ivey PMIs.EURUSD - Technical charts in detail
GBPUSD – technical overview
Signs have emerged of the market wanting to put in a longer-term base after collapsing to a record low in September 2022. The November 2022 monthly close back above 1.2000 strengthens this prospect. Any setbacks should now be well supported ahead of 1.2000. Next key resistance comes in at 1.2667.GBPUSD – fundamental overview
The local UK futures market now sees the possibility for three more BOE rate increases by September. Key standouts on Thursday’s calendar include German trade, PMI reads out of the Eurozone and UK, Eurozone producer prices, the ECB policy decision, Canada trade, US trade, US initial jobless claims, and Canada Ivey PMIs.USDJPY – technical overview
The major pair has seen a nice recovery following the massive correction out from multi-year highs. Setbacks have finally been well supported ahead of 125.00 in the 127s thus far. At this stage, it looks like the market could be wanting to resume the bigger picture uptrend and head back towards a retest of that multi-year high from October 2022 up at 151.95. Look for any weakness to continue to be well supported in favor of higher lows along the way.USDJPY – fundamental overview
Collapsing energy prices and some risk off flow have really factored into this latest run of impressive Yen demand. Key standouts on Thursday’s calendar include German trade, PMI reads out of the Eurozone and UK, Eurozone producer prices, the ECB policy decision, Canada trade, US trade, US initial jobless claims, and Canada Ivey PMIs.AUDUSD – technical overview
There are signs of the potential formation of a longer-term base following the late 2022 surge back above 0.6500. The recent weekly close back above previous support now turned resistance at 0.6682 strengthens the outlook for a bullish structural shift. Next key resistance comes in at 0.7284. Setbacks should be well supported ahead of 0.6500.AUDUSD – fundamental overview
The Australian Dollar has been a standout outperformer in recent sessions. The currency has been finding demand in the aftermath of a surprise 25 basis point rate hike from the RBA and Wednesday's better than expected Aussie retail sales print. At the same time, rallies have been finding sellers on caution from risk off flow. Key standouts on Thursday’s calendar include German trade, PMI reads out of the Eurozone and UK, Eurozone producer prices, the ECB policy decision, Canada trade, US trade, US initial jobless claims, and Canada Ivey PMIs.USDCAD – technical overview
A recent surge back above 1.3000 signals an end to a period of bearish consolidation and suggests the market is in the process of carving out a more significant longer-term base. Next key resistance now comes in up into the 1.4000 area. Setbacks should be very well supported down into the 1.3000 area.USDCAD – fundamental overview
The Canadian Dollar has been finding some renewed demand after the price of oil rebounded post an unnerving decline this week. Key standouts on Thursday’s calendar include German trade, PMI reads out of the Eurozone and UK, Eurozone producer prices, the ECB policy decision, Canada trade, US trade, US initial jobless claims, and Canada Ivey PMIs.NZDUSD – technical overview
Overall pressure remains on the downside with the market once again stalling out on a run up into the 0.6500 area. Ultimately, a break back above 0.6577 would be required to take the immediate pressure off the downside.NZDUSD – fundamental overview
The New Zealand Dollar has been getting an added boost this week after employment and wage data came in well above forecast. This shifts RBNZ bets back to the hawkish side and has moved yield differentials back in favor of the New Zealand Dollar. Key standouts on Thursday’s calendar include German trade, PMI reads out of the Eurozone and UK, Eurozone producer prices, the ECB policy decision, Canada trade, US trade, US initial jobless claims, and Canada Ivey PMIs.US SPX 500 – technical overview
Longer-term technical studies are in the process of unwinding from extended readings off record highs. Look for rallies to be well capped in favor of lower tops and lower lows. A monthly close back above 4300 will be required at a minimum to take the immediate pressure off the downside. Next major support comes in at 3806.US SPX 500 – fundamental overview
We've finally reached a point in the cycle where the Fed recognizes unanchored inflation expectations pose a greater downside risk than over-tightening. This is significant, as it means less investor friendly monetary policy that risks potential recession in the months ahead. Overall, we expect inflation to continue to be a problem in 2023 that results in downside pressure into rallies.GOLD (SPOT) – technical overview
The 2019 breakout above the 2016 high at 1375 was a significant development, opening the door for fresh record highs. Setbacks should now be well supported above 1600 on a monthly close basis ahead of the next major upside extension. The recent break back above 1808 strengthens the bullish outlook. Next major resistance comes in at 2100, above which opens the next extension towards 2,500.GOLD (SPOT) – fundamental overview
The yellow metal continues to be well supported on dips with solid demand from medium and longer-term accounts. These players are more concerned about inflation risk and a less upbeat global growth outlook. All of this should keep the commodity well supported, with many market participants also fleeing to the hard asset as the grand dichotomy of record high equities and record low yields comes to an unnerving climax.