


Next 24 hours: Pound prints another yearly high against the Buck
Today’s report: Recent price action not so convincing
Last Friday’s price action in markets has left us somewhat confused, and certainly uncertain enough to issue a warning of caution. At the moment, we’re seeing a clear breakaway in monetary policy communications, with the Fed looking like it might be getting closer to considering a pause, while other major central banks are still focused on the possibility of higher rates.
Wake-up call
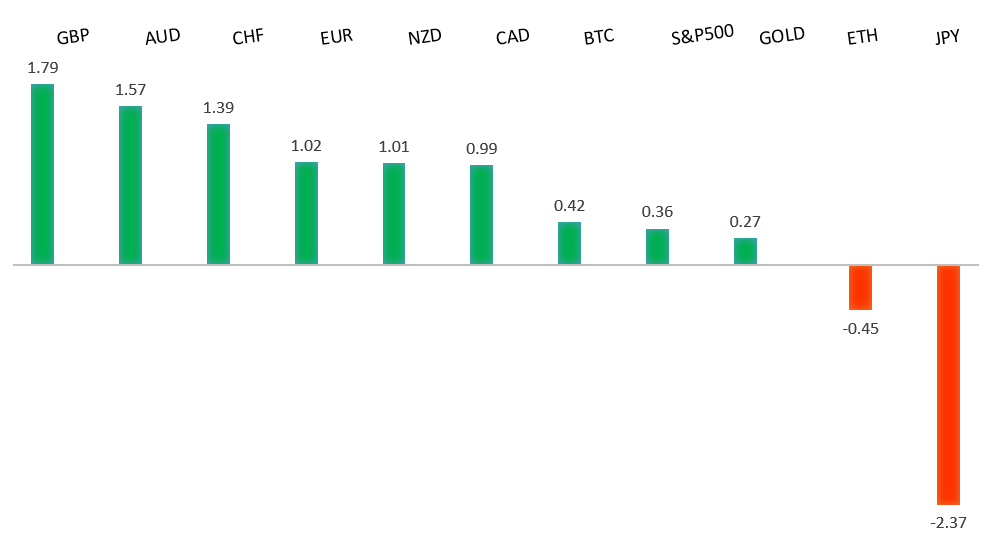
Peformance chart: 30 Day Performance vs. US dollar (%)
Suggested reading
- A Novel Way to End an Energy Crisis, D. Fickling, Financial Times (May 7, 2023)
- King Charles III crowned at London's Westminster Abbey, Financial Times (May 6, 2023)
Chart talk: Technical & fundamental highlights
Choose pair:
EURUSD – technical overview
The Euro remains well supported on dips following a run to the topside through 1.1000 earlier this year. Any additional setbacks should be well supported ahead of 1.0500 in favor of the formation of the next major higher low and a bullish continuation. Ultimately, only a monthly close back below 1.0500 would give reason for concern. Next key resistance comes in the form of the March 2022 high at 1.1185.EURUSD – fundamental overview
The Euro has been well supported overall on diverging central bank policy between the Fed and ECB. However, we have seen some selling pressure into rallies after German factory orders and France retail sales disappointed. Key standouts on Monday’s calendar come from German industrial production, US wholesale inventories, and US consumer inflation expectations.EURUSD - Technical charts in detail
GBPUSD – technical overview
Signs have emerged of the market wanting to put in a longer-term base after collapsing to a record low in September 2022. The November 2022 monthly close back above 1.2000 strengthens this prospect. Any setbacks should now be well supported ahead of 1.2000. Next key resistance comes in at 1.2667.GBPUSD – fundamental overview
The Pound has extended its run of gains in 2023 as the BOE policy path is seen outpacing the other major central banks. The UK rates market now sees 60 basis points more of hikes by September. Meanwhile, UK construction PMIs showed a mild improvement. Key standouts on Monday’s calendar come from German industrial production, US wholesale inventories, and US consumer inflation expectations.USDJPY – technical overview
The major pair has seen a nice recovery following the massive correction out from multi-year highs. Setbacks have finally been well supported ahead of 125.00 in the 127s thus far. At this stage, it looks like the market could be wanting to resume the bigger picture uptrend and head back towards a retest of that multi-year high from October 2022 up at 151.95. Look for any weakness to continue to be well supported in favor of higher lows along the way.USDJPY – fundamental overview
Weakness in energy prices and risk off flow have factored into a recent run of Yen demand, though we did see some alleviation of this flow on Friday as stocks rallied along with energy prices. Key standouts on Monday’s calendar come from German industrial production, US wholesale inventories, and US consumer inflation expectations.AUDUSD – technical overview
There are signs of the potential formation of a longer-term base following the late 2022 surge back above 0.6500. The recent weekly close back above previous support now turned resistance at 0.6682 strengthens the outlook for a bullish structural shift. Next key resistance comes in at 0.7284. Setbacks should be well supported ahead of 0.6500.AUDUSD – fundamental overview
The Australian Dollar has been better bid of late on the back of risk on flow and hawkish RBA comments. Last week's RBA policy statement warned rates could go higher than current guidance at 3.85%. Key standouts on Monday’s calendar come from German industrial production, US wholesale inventories, and US consumer inflation expectations.USDCAD – technical overview
A recent surge back above 1.3000 signals an end to a period of bearish consolidation and suggests the market is in the process of carving out a more significant longer-term base. Next key resistance now comes in up into the 1.4000 area. Setbacks should be very well supported down into the 1.3000 area.USDCAD – fundamental overview
The Canadian Dollar got a strong boost on Friday after Canada jobs came in much better than expected. This along with a recovering oil market kept the Loonie well bid into the weekly close. Key standouts on Monday’s calendar come from German industrial production, US wholesale inventories, and US consumer inflation expectations.NZDUSD – technical overview
Overall pressure remains on the downside with the market once again stalling out on a run up into the 0.6500 area. Ultimately, a break back above 0.6577 would be required to take the immediate pressure off the downside.NZDUSD – fundamental overview
The New Zealand Dollar has been getting an added boost after employment and wage data came in well above forecast last week. This shifts RBNZ bets back to the hawkish side and has moved yield differentials back in favor of the New Zealand Dollar. Key standouts on Monday’s calendar come from German industrial production, US wholesale inventories, and US consumer inflation expectations.US SPX 500 – technical overview
Longer-term technical studies are in the process of unwinding from extended readings off record highs. Look for rallies to be well capped in favor of lower tops and lower lows. A monthly close back above 4300 will be required at a minimum to take the immediate pressure off the downside. Next major support comes in at 3806.US SPX 500 – fundamental overview
We've finally reached a point in the cycle where the Fed recognizes unanchored inflation expectations pose a greater downside risk than over-tightening. This is significant, as it means less investor friendly monetary policy that risks potential recession in the months ahead. Overall, we expect inflation to continue to be a problem in 2023 that results in downside pressure into rallies.GOLD (SPOT) – technical overview
The 2019 breakout above the 2016 high at 1375 was a significant development, opening the door for fresh record highs. Setbacks should now be well supported above 1600 on a monthly close basis ahead of the next major upside extension. The recent break back above 1808 strengthens the bullish outlook. Next major resistance comes in at 2100, above which opens the next extension towards 2,500.GOLD (SPOT) – fundamental overview
The yellow metal continues to be well supported on dips with solid demand from medium and longer-term accounts. These players are more concerned about inflation risk and a less upbeat global growth outlook. All of this should keep the commodity well supported, with many market participants also fleeing to the hard asset as the grand dichotomy of record high equities and record low yields comes to an unnerving climax.