


Today’s report: Trying to make sense of the price action
This has been a strange week of price action. It’s not too often that you see both the US Dollar and US equities heading in the same direction. And yet, this is exactly what we’ve been seeing.
Wake-up call
- ECB Lagarde
- US yields
- hotter inflation
- AUDUSD Weak employment offset by higher stocks
- BoC odds
- producer prices
- Inflation headache
- Dealers report
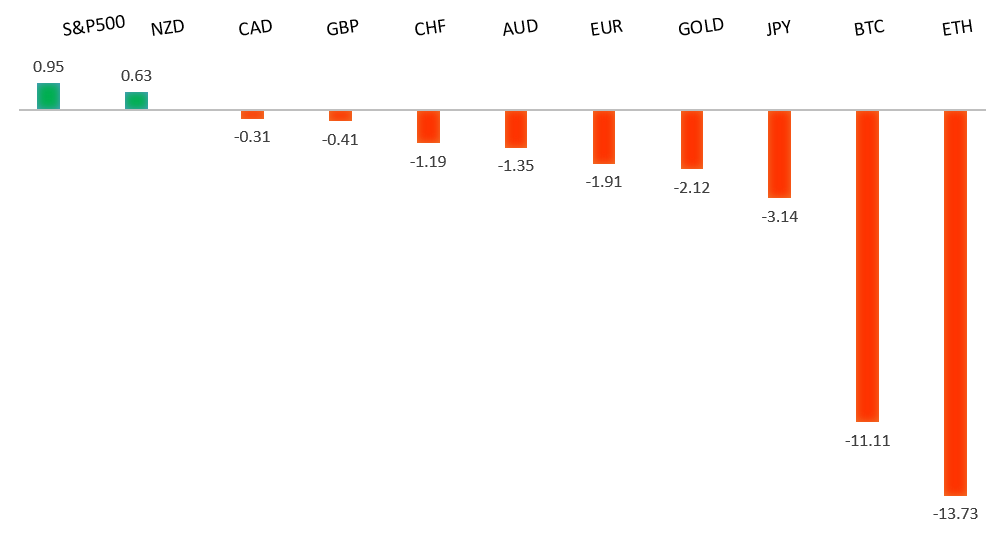
Peformance chart: 30 Day Performance vs. US dollar (%)
Suggested reading
- This Equities Rally Is Running on Hope and a Story, J. Authers, Bloomberg (May 19, 2023)
- The London Restaurant that Changes Chefs Every Week, D. Garrahan, Financial Times (April 18, 2023)
Chart talk: Technical & fundamental highlights
Choose pair:
EURUSD – technical overview
The Euro remains well supported on dips following a run to the topside through 1.1000 earlier this year. Any additional setbacks should be well supported ahead of 1.0500 in favor of the formation of the next major higher low and a bullish continuation. Ultimately, only a monthly close back below 1.0500 would give reason for concern. Next key resistance comes in the form of the March 2022 high at 1.1185.EURUSD – fundamental overview
Absence of economic data out of the Eurozone on Thursday left the Euro trading on bigger themes of broad based US Dollar demand. Key standouts on Friday’s calendar come from German producer prices, Canada retail sales, and speeches from Fed Chair Powell and ECB Lagarde.EURUSD - Technical charts in detail
GBPUSD – technical overview
Signs have emerged of the market wanting to put in a longer-term base after collapsing to a record low in September 2022. The November 2022 monthly close back above 1.2000 strengthens this prospect. Any setbacks should now be well supported ahead of 1.2000. Next key resistance comes in at 1.2680.GBPUSD – fundamental overview
There wasn't much to talk about on Thursday, with no major developments out of the UK and the market left to focus on rising US yields and a big rally in the US Dollar. Key standouts on Friday’s calendar come from German producer prices, Canada retail sales, and speeches from Fed Chair Powell and ECB Lagarde.USDJPY – technical overview
The major pair has seen a nice recovery following the massive correction out from multi-year highs. Setbacks have finally been well supported ahead of 125.00 in the 127s thus far. At this stage, it looks like the market could be wanting to resume the bigger picture uptrend and head back towards a retest of that multi-year high from October 2022 up at 151.95. Look for any weakness to continue to be well supported in favor of higher lows along the way.USDJPY – fundamental overview
A solid run of Japan economic data and this latest above forecast Japan inflation rate have done nothing to stop the Yen from sinking to fresh yearly lows against the US Dollar. Ultimately, the BOJ remains committed to holding the line on NIRP and YCC policy, while yields are back on the rise in the US. Key standouts on Friday’s calendar come from German producer prices, Canada retail sales, and speeches from Fed Chair Powell and ECB Lagarde.AUDUSD – technical overview
There are signs of the potential formation of a longer-term base following the late 2022 surge back above 0.6500. The recent weekly close back above previous support now turned resistance at 0.6682 strengthens the outlook for a bullish structural shift. Next key resistance comes in at 0.7284. Setbacks should be well supported ahead of 0.6500.AUDUSD – fundamental overview
The Australian Dollar took a hit on the recent Aussie employment data miss and broad US Dollar demand, though setbacks have been somewhat offset by an ongoing bid for US equities. Key standouts on Friday’s calendar come from German producer prices, Canada retail sales, and speeches from Fed Chair Powell and ECB Lagarde.USDCAD – technical overview
A recent surge back above 1.3000 signals an end to a period of bearish consolidation and suggests the market is in the process of carving out a more significant longer-term base. Next key resistance now comes in up into the 1.4000 area. Setbacks should be very well supported down into the 1.3000 area.USDCAD – fundamental overview
The Canadian Dollar has held up better than most of its peers on account of a local rate market in Canada that has pushed up odds for a June hike to about 40%. This comes after this week's Canada CPI data came in above forecast. Key standouts on Friday’s calendar come from German producer prices, Canada retail sales, and speeches from Fed Chair Powell and ECB Lagarde.NZDUSD – technical overview
Overall pressure remains on the downside with the market once again stalling out on a run up into the 0.6500 area. Ultimately, a break back above 0.6577 would be required to take the immediate pressure off the downside.NZDUSD – fundamental overview
The New Zealand Dollar has been getting help from higher US equities, though the rally is running into some selling on Thursday after New Zealand producer prices came in softer than expected. Key standouts on Friday’s calendar come from German producer prices, Canada retail sales, and speeches from Fed Chair Powell and ECB Lagarde.US SPX 500 – technical overview
Longer-term technical studies are in the process of unwinding from extended readings off record highs. Look for rallies to be well capped in favor of lower tops and lower lows. A monthly close back above 4300 will be required at a minimum to take the immediate pressure off the downside. Next major support comes in at 4049.US SPX 500 – fundamental overview
We've finally reached a point in the cycle where the Fed recognizes unanchored inflation expectations pose a greater downside risk than over-tightening. This is significant, as it means less investor friendly monetary policy that risks potential recession in the months ahead. Overall, we expect inflation to continue to be a problem in 2023 that results in downside pressure into rallies.GOLD (SPOT) – technical overview
The 2019 breakout above the 2016 high at 1375 was a significant development, opening the door for fresh record highs. Setbacks should now be well supported above 1600 on a monthly close basis ahead of the next major upside extension. The recent break back above 1808 strengthens the bullish outlook. Next major resistance comes in at 2100, above which opens the next extension towards 2,500.GOLD (SPOT) – fundamental overview
The yellow metal continues to be well supported on dips with solid demand from medium and longer-term accounts. These players are more concerned about inflation risk and a less upbeat global growth outlook. All of this should keep the commodity well supported, with many market participants also fleeing to the hard asset as the grand dichotomy of record high equities and record low yields comes to an unnerving climax.