


Next 24 hours: The disconnect between stocks and currencies
Today’s report: US equities race higher post US jobs report
It feels like the latest run higher in US equities has come from the Friday US jobs report, which showed higher unemployment and softer average hourly earnings, two things that would add pressure on the Fed to lean back towards more accommodative, investor friendly monetary policy.
Wake-up call
- ECB Panetta
- profit taking
- BOJ Ueda
- minimum wage
- vehicle sales
- USD inflow
- Inflation headache
- Dealers report
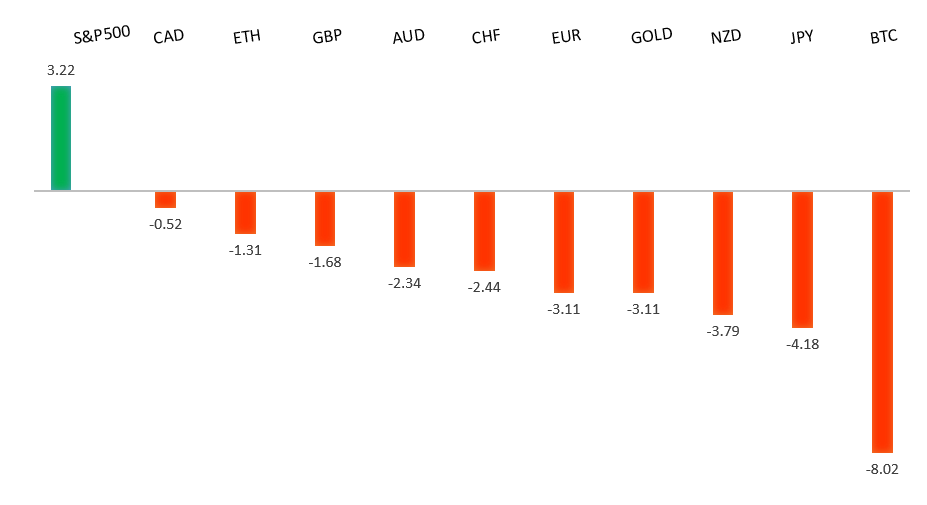
Peformance chart: 30 Day Performance vs. US dollar (%)
Suggested reading
- Saudi Arabia Is Taking the Oil Market Back to the Future, D. Fickling, Bloomberg (June 5, 2023)
- Markets Sense Inflation Clock Is Running, M. Luzzetti, Deutsche Bank (May 30, 2023)
Chart talk: Technical & fundamental highlights
Choose pair:
EURUSD – technical overview
The Euro remains well supported on dips following a run to the topside through 1.1000 earlier this year. Any additional setbacks should be well supported ahead of 1.0500 in favor of the formation of the next major higher low and a bullish continuation. Ultimately, only a monthly close back below 1.0500 would give reason for concern. Next key resistance comes in the form of the March 2022 high at 1.1185.EURUSD – fundamental overview
The Euro pulled back from a 7 day high on Friday, though there wasn't a whole lot beyond broad US Dollar demand to reconcile the price action. We did hear some dovish comments from ECB Panetta, but these comments were offset by ECB Vasle and Maklouf. Key standouts on Monday’s calendar come from German trade, German, Eurozone and UK PMI reads, Eurozone producer prices, US ISM, and factory orders.EURUSD - Technical charts in detail
GBPUSD – technical overview
Signs have emerged of the market wanting to put in a longer-term base after collapsing to a record low in September 2022. The November 2022 monthly close back above 1.2000 strengthens this prospect. Any setbacks should now be well supported ahead of 1.2000. Next key resistance comes in at 1.2680.GBPUSD – fundamental overview
Most of the latest round of Sterling setbacks come from profit taking and broad based US Dollar demand. Key standouts on Monday’s calendar come from German trade, German, Eurozone and UK PMI reads, Eurozone producer prices, US ISM, and factory orders.USDJPY – technical overview
The major pair has seen a nice recovery following the massive correction out from multi-year highs. Setbacks have finally been well supported ahead of 125.00 in the 127s thus far. At this stage, it looks like the market could be wanting to resume the bigger picture uptrend and head back towards a retest of that multi-year high from October 2022 up at 151.95. Look for any weakness to continue to be well supported in favor of higher lows along the way.USDJPY – fundamental overview
BOJ Governor Ueda said he cannot say when the BOJ the will achieve its 2% price goal. He defended the central bank monetary policy stance, stating easing contributes to productivity in the long term while shifting to tightening could burden healthy firms. Key standouts on Monday’s calendar come from German trade, German, Eurozone and UK PMI reads, Eurozone producer prices, US ISM, and factory orders.AUDUSD – technical overview
There are signs of the potential formation of a longer-term base following the late 2022 surge back above 0.6500. Next key resistance comes in at 0.7284. Setbacks should continue to be well supported in the 0.6500 area. Only a monthly close below 0.6500 would give reason for rethink.AUDUSD – fundamental overview
Australian Dollar gains have outpaced G10 peers. Australia's Fair Work Commission raised the national minimum wage by 5.75% from July 1, more than last year's 4.6% boost. Key standouts on Monday’s calendar come from German trade, German, Eurozone and UK PMI reads, Eurozone producer prices, US ISM, and factory orders.USDCAD – technical overview
A recent surge back above 1.3000 signals an end to a period of bearish consolidation and suggests the market is in the process of carving out a more significant longer-term base. Next key resistance now comes in up into the 1.4000 area. Setbacks should be very well supported down into the 1.3000 area.USDCAD – fundamental overview
Higher oil and a rise in Canada motor vehicle sales have helped to generate the latest wave of momentum into the Canadian Dollar. Key standouts on Monday’s calendar come from German trade, German, Eurozone and UK PMI reads, Eurozone producer prices, US ISM, and factory orders.NZDUSD – technical overview
Overall pressure remains on the downside with the market once again stalling out on a run up into the 0.6500 area. Ultimately, a break back above 0.6577 would be required to take the immediate pressure off the downside. A monthly close below 0.6000 would intensify bearish price action.NZDUSD – fundamental overview
The New Zealand Dollar struggled with more US Dollar inflows post Friday's US jobs report. We also saw selling on discouraging NZ terms of trade data and more yield differential flows on expectation for diverging monetary policy outlooks. Key standouts on Monday’s calendar come from German trade, German, Eurozone and UK PMI reads, Eurozone producer prices, US ISM, and factory orders.US SPX 500 – technical overview
Longer-term technical studies are in the process of unwinding from extended readings off record highs. Look for rallies to be well capped in favor of lower tops and lower lows. A monthly close back above 4300 will be required at a minimum to take the immediate pressure off the downside. Next major support comes in at 4049.US SPX 500 – fundamental overview
We've finally reached a point in the cycle where the Fed recognizes unanchored inflation expectations pose a greater downside risk than over-tightening. This is significant, as it means less investor friendly monetary policy that risks potential recession in the months ahead. Overall, we expect inflation to continue to be a problem in 2023 that results in downside pressure into rallies.GOLD (SPOT) – technical overview
The 2019 breakout above the 2016 high at 1375 was a significant development, opening the door for fresh record highs. Setbacks should now be well supported above 1600 on a monthly close basis ahead of the next major upside extension. The recent break back above 1808 strengthens the bullish outlook. Next major resistance comes in at 2100, above which opens the next extension towards 2,500.GOLD (SPOT) – fundamental overview
The yellow metal continues to be well supported on dips with solid demand from medium and longer-term accounts. These players are more concerned about inflation risk and a less upbeat global growth outlook. All of this should keep the commodity well supported, with many market participants also fleeing to the hard asset as the grand dichotomy of record high equities and record low yields comes to an unnerving climax.