


Next 24 hours: Shrugging off the bad, focusing on the good
Today’s report: Leaning back to the hawkish side
There haven’t been any major moves in financial markets in recent sessions, and it still feels like we’ve been in a bit of a lull since getting past the US debt ceiling drama. The focus should be shifting back to the Fed policy outlook, but as of yet, we haven’t had too many updates on that front.
Wake-up call
- below forecast
- PMI components
- Asset managers
- Aussie GDP
- BoC decision
- following Aussie
- Inflation headache
- Dealers report
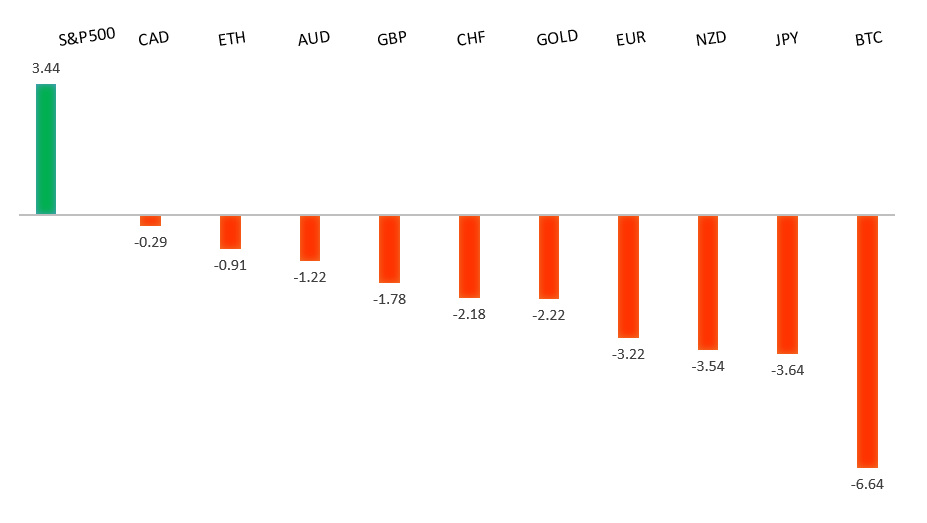
Peformance chart: 30 Day Performance vs. US dollar (%)
Suggested reading
- Sequoia Revamped to Beat Tiger. It’s Doing It Again, S. Ren, Bloomberg (June 7, 2023)
- As Inflation Fades, Growth Becomes the Worry, J. Calhoun, Alhambra (June 4, 2023)
Chart talk: Technical & fundamental highlights
Choose pair:
EURUSD – technical overview
The Euro remains well supported on dips following a run to the topside through 1.1000 earlier this year. Any additional setbacks should be well supported ahead of 1.0500 in favor of the formation of the next major higher low and a bullish continuation. Ultimately, only a monthly close back below 1.0500 would give reason for concern. Next key resistance comes in the form of the March 2022 high at 1.1185.EURUSD – fundamental overview
The Euro has been trading with a softer tone into Wednesday after a round of less upbeat data out of the zone. ECB consumer inflation expectations dipped, while German factory orders and Eurozone retail sales were below forecast. Key standouts on Wednesday’s calendar come from German industrial production, ECB speak, Canada trade, US trade, and the Bank of Canada policy decision.EURUSD - Technical charts in detail
GBPUSD – technical overview
Signs have emerged of the market wanting to put in a longer-term base after collapsing to a record low in September 2022. The November 2022 monthly close back above 1.2000 strengthens this prospect. Any setbacks should now be well supported ahead of 1.2000. Next key resistance comes in at 1.2680.GBPUSD – fundamental overview
There wasn't much going on with the Pound on Tuesday, though we did see some selling on softer components within the UK construction PMI data. Key standouts on Wednesday’s calendar come from German industrial production, ECB speak, Canada trade, US trade, and the Bank of Canada policy decision.USDJPY – technical overview
The major pair has seen a nice recovery following the massive correction out from multi-year highs. Setbacks have finally been well supported ahead of 125.00 in the 127s thus far. At this stage, it looks like the market could be wanting to resume the bigger picture uptrend and head back towards a retest of that multi-year high from October 2022 up at 151.95. Look for any weakness to continue to be well supported in favor of higher lows along the way.USDJPY – fundamental overview
Asset managers are joining hedge funds in increasing bearish Yen bets on speculation the BOJ won't be moving any time soon to adjust ultra loose monetary policy. Any Yen upside is therefore expected to be met with renewed selling interest. Key standouts on Wednesday’s calendar come from German industrial production, ECB speak, Canada trade, US trade, and the Bank of Canada policy decision.AUDUSD – technical overview
There are signs of the potential formation of a longer-term base following the late 2022 surge back above 0.6500. Next key resistance comes in at 0.7284. Setbacks should continue to be well supported in the 0.6500 area. Only a monthly close below 0.6500 would give reason for rethink.AUDUSD – fundamental overview
More hawkish talk from RBA Lowe has supported the Australian Dollar into Wednesday, though at the same time, rallies have been capped after Aussie GDP came in below forecast, to produce the weakest result since the lockdowns in September 2021. Key standouts on Wednesday’s calendar come from German industrial production, ECB speak, Canada trade, US trade, and the Bank of Canada policy decision.USDCAD – technical overview
A recent surge back above 1.3000 signals an end to a period of bearish consolidation and suggests the market is in the process of carving out a more significant longer-term base. Next key resistance now comes in up into the 1.4000 area. Setbacks should be very well supported down into the 1.3000 area.USDCAD – fundamental overview
The Canadian Dollar has been trading on firmer footing despite a round of soft data in the form of plunging building permits and declining Ivey PMIs. There is little to help reconcile the price action other than positioning into the expectation for a hawkish communication from the Bank of Canada later today. Key standouts on Wednesday’s calendar come from German industrial production, ECB speak, Canada trade, US trade, and the Bank of Canada policy decision.NZDUSD – technical overview
Overall pressure remains on the downside with the market once again stalling out on a run up into the 0.6500 area. Ultimately, a break back above 0.6577 would be required to take the immediate pressure off the downside. A monthly close below 0.6000 would intensify bearish price action.NZDUSD – fundamental overview
The New Zealand Dollar has managed to trade higher this week, mostly on the back of Aussie gains from the RBA rate hike. At the same time, the Kiwi currency is a clear laggard against its commodity cousins, with the RBNZ outlook much less hawkish and New Zealand data looking softer of late. Key standouts on Wednesday’s calendar come from German industrial production, ECB speak, Canada trade, US trade, and the Bank of Canada policy decision.US SPX 500 – technical overview
Longer-term technical studies are in the process of unwinding from extended readings off record highs. Look for rallies to be well capped in favor of lower tops and lower lows. A monthly close back above 4300 will be required at a minimum to take the immediate pressure off the downside. Next major support comes in at 4049.US SPX 500 – fundamental overview
We've finally reached a point in the cycle where the Fed recognizes unanchored inflation expectations pose a greater downside risk than over-tightening. This is significant, as it means less investor friendly monetary policy that risks potential recession in the months ahead. Overall, we expect inflation to continue to be a problem in 2023 that results in downside pressure into rallies.GOLD (SPOT) – technical overview
The 2019 breakout above the 2016 high at 1375 was a significant development, opening the door for fresh record highs. Setbacks should now be well supported above 1600 on a monthly close basis ahead of the next major upside extension. The recent break back above 1808 strengthens the bullish outlook. Next major resistance comes in at 2100, above which opens the next extension towards 2,500.GOLD (SPOT) – fundamental overview
The yellow metal continues to be well supported on dips with solid demand from medium and longer-term accounts. These players are more concerned about inflation risk and a less upbeat global growth outlook. All of this should keep the commodity well supported, with many market participants also fleeing to the hard asset as the grand dichotomy of record high equities and record low yields comes to an unnerving climax.