


Next 24 hours: US jobless claims highlights Thursday docket
Today’s report: Plenty of hawkishness to go around
We haven’t seen a lot in the way of volatility and price action this week, but what we have seen is a clear message coming from many central banks. That message is one of hawkishness.
Wake-up call
- hawkish speak
- OECD upgrades
- Asset managers
- below forecast
- BoC hike
- slowing growth
- Inflation headache
- Dealers report
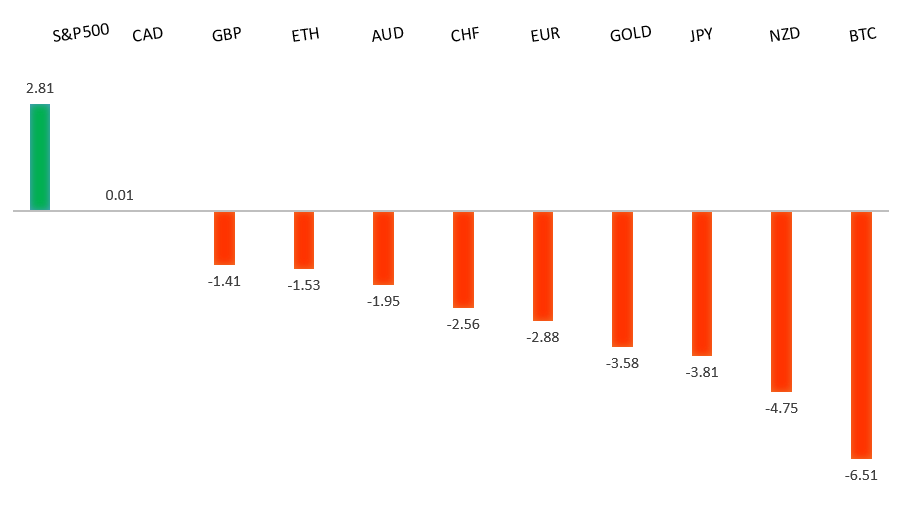
Peformance chart: 30 Day Performance vs. US dollar (%)
Suggested reading
- Discretion(ary) Is the Better Part of Consumption, J. Authers, Bloomberg (June 7, 2023)
- Return of Iger, 'King of Hollywood', D. Garrahan, Financial Times (June 8, 2023)
Chart talk: Technical & fundamental highlights
Choose pair:
EURUSD – technical overview
The Euro remains well supported on dips following a run to the topside through 1.1000 earlier this year. Any additional setbacks should be well supported ahead of 1.0500 in favor of the formation of the next major higher low and a bullish continuation. Ultimately, only a monthly close back below 1.0500 would give reason for concern. Next key resistance comes in the form of the March 2022 high at 1.1185.EURUSD – fundamental overview
The Euro traded mostly sideways and unchanged on Wednesday. The currency was supported on hawkish ECB comments, but weighed down on softer economic data out of the Eurozone. Key standouts on Thursday’s calendar include Eurozone GDP, and US initial jobless claims.EURUSD - Technical charts in detail
GBPUSD – technical overview
Signs have emerged of the market wanting to put in a longer-term base after collapsing to a record low in September 2022. The November 2022 monthly close back above 1.2000 strengthens this prospect. Any setbacks should now be well supported ahead of 1.2000. Next key resistance comes in at 1.2680.GBPUSD – fundamental overview
The Pound put in a mildly positive performance on Wednesday, getting help from an upgraded OECD UK growth forecast and ramped up expectations for more BOE rate hikes ahead. Key standouts on Thursday’s calendar include Eurozone GDP, and US initial jobless claims.USDJPY – technical overview
The major pair has seen a nice recovery following the massive correction out from multi-year highs. Setbacks have finally been well supported ahead of 125.00 in the 127s thus far. At this stage, it looks like the market could be wanting to resume the bigger picture uptrend and head back towards a retest of that multi-year high from October 2022 up at 151.95. Look for any weakness to continue to be well supported in favor of higher lows along the way.USDJPY – fundamental overview
Asset managers are joining hedge funds in increasing bearish Yen bets on speculation the BOJ won't be moving any time soon to adjust ultra loose monetary policy. Any Yen upside is therefore expected to be met with renewed selling interest. Key standouts on Thursday’s calendar include Eurozone GDP, and US initial jobless claims.AUDUSD – technical overview
There are signs of the potential formation of a longer-term base following the late 2022 surge back above 0.6500. Next key resistance comes in at 0.7284. Setbacks should continue to be well supported in the 0.6500 area. Only a monthly close below 0.6500 would give reason for rethink.AUDUSD – fundamental overview
More hawkish talk from RBA Lowe has supported the Australian Dollar on Wednesday, though at the same time, rallies ended up getting sold into on softer than expected Aussie GDP reads that produced the weakest result since the lockdowns in September 2021. Key standouts on Thursday’s calendar include Eurozone GDP, and US initial jobless claims.USDCAD – technical overview
A recent surge back above 1.3000 signals an end to a period of bearish consolidation and suggests the market is in the process of carving out a more significant longer-term base. Next key resistance now comes in up into the 1.4000 area. Setbacks should be very well supported down into the 1.3000 area.USDCAD – fundamental overview
The Canadian Dollar got a nice boost from a 25 basis point rate hike from the Bank of Canada, along with an accompanying hawkish communication. Key standouts on Thursday’s calendar include Eurozone GDP, and US initial jobless claims.NZDUSD – technical overview
Overall pressure remains on the downside with the market once again stalling out on a run up into the 0.6500 area. Ultimately, a break back above 0.6577 would be required to take the immediate pressure off the downside. A monthly close below 0.6000 would intensify bearish price action.NZDUSD – fundamental overview
Concerns over slowing growth in New Zealand have resulted in a lagging New Zealand Dollar that has also been weighed down by expectations the RBNZ will be leaning more towards accommodation, all while other central banks continue to lean more hawkish. Key standouts on Thursday’s calendar include Eurozone GDP, and US initial jobless claims.US SPX 500 – technical overview
Longer-term technical studies are in the process of unwinding from extended readings off record highs. Look for rallies to be well capped in favor of lower tops and lower lows. A monthly close back above 4300 will be required at a minimum to take the immediate pressure off the downside. Next major support comes in at 4049.US SPX 500 – fundamental overview
We've finally reached a point in the cycle where the Fed recognizes unanchored inflation expectations pose a greater downside risk than over-tightening. This is significant, as it means less investor friendly monetary policy that risks potential recession in the months ahead. Overall, we expect inflation to continue to be a problem in 2023 that results in downside pressure into rallies.GOLD (SPOT) – technical overview
The 2019 breakout above the 2016 high at 1375 was a significant development, opening the door for fresh record highs. Setbacks should now be well supported above 1600 on a monthly close basis ahead of the next major upside extension. The recent break back above 1808 strengthens the bullish outlook. Next major resistance comes in at 2100, above which opens the next extension towards 2,500.GOLD (SPOT) – fundamental overview
The yellow metal continues to be well supported on dips with solid demand from medium and longer-term accounts. These players are more concerned about inflation risk and a less upbeat global growth outlook. All of this should keep the commodity well supported, with many market participants also fleeing to the hard asset as the grand dichotomy of record high equities and record low yields comes to an unnerving climax.