


Next 24 hours: Market to digest latest US inflation data
Today’s report: Big day of economic data
Monday was a day of consolidation in the currency market, more yearly highs in US equities, and shakeup in commodities, with a lot of that having to do with China’s currency falling to its lowest levels since December.
Wake-up call
- German inflation
- BOE Mann
- BOJ Ueda
- RMB, metals
- Oil dump
- card spending
- Inflation headache
- Dealers report
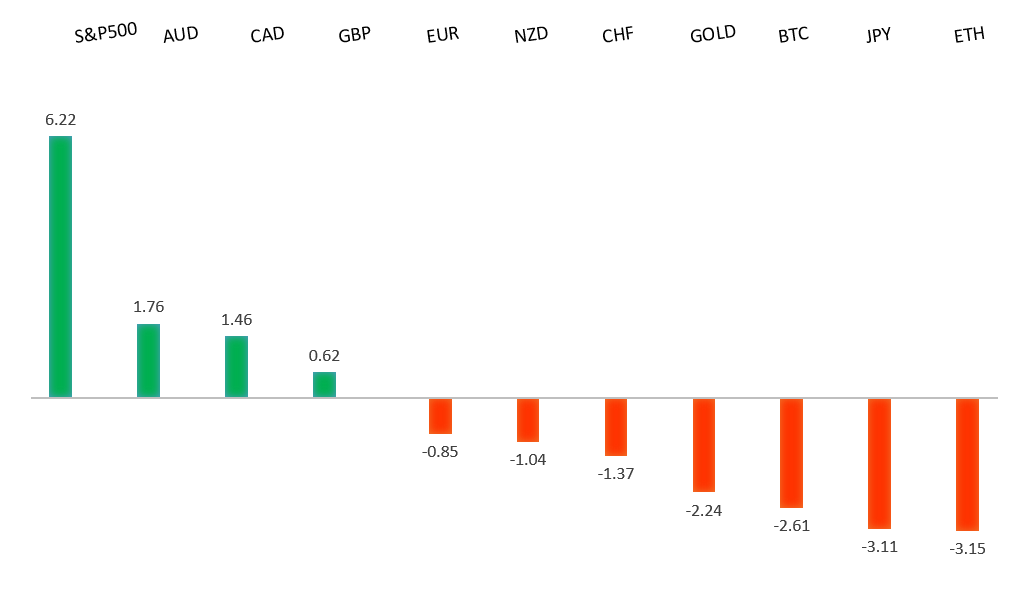
Peformance chart: 30 Day Performance vs. US dollar (%)
Suggested reading
- When Retail Investors Are All Zigging, Is It Time to Zag?, J. Levin, Bloomberg (June 12, 2023)
- What Happened In 1971? It’s a Question Everyone Should Ask, J. Tamny, Forbes (June 11, 2023)
Chart talk: Technical & fundamental highlights
Choose pair:
EURUSD – technical overview
The Euro remains well supported on dips following a run to the topside through 1.1000 earlier this year. Any additional setbacks should be well supported ahead of 1.0500 in favor of the formation of the next major higher low and a bullish continuation. Ultimately, only a monthly close back below 1.0500 would give reason for concern. Next key resistance comes in the form of the March 2022 high at 1.1185.EURUSD – fundamental overview
European and US markets were devoid of meaningful data on Monday and the Euro wasn't able to do much with the price action. Key standouts on Tuesday’s calendar come from German inflation, UK employment, German and Eurozone ZEW reads, and US inflation.EURUSD - Technical charts in detail
GBPUSD – technical overview
Signs have emerged of the market wanting to put in a longer-term base after collapsing to a record low in September 2022. The November 2022 monthly close back above 1.2000 strengthens this prospect. Any setbacks should now be well supported ahead of 1.2000. Next key resistance comes in at 1.2680.GBPUSD – fundamental overview
The Pound reversed course on Monday, getting spooked about inflation warnings. BOE Mann said service sector inflation was very concerning. While the central banker stopped short of predicting a recession, he said the outlook for some would be pretty tough. Key standouts on Tuesday’s calendar come from German inflation, UK employment, German and Eurozone ZEW reads, and US inflation.USDJPY – technical overview
The major pair has seen a nice recovery following the massive correction out from multi-year highs. Setbacks have finally been well supported ahead of 125.00 in the 127s thus far. At this stage, it looks like the market could be wanting to resume the bigger picture uptrend and head back towards a retest of that multi-year high from October 2022 up at 151.95. Look for any weakness to continue to be well supported in favor of higher lows along the way.USDJPY – fundamental overview
The Yen came back under pressure on Monday following some softer Japan inflation reads and a slide in machine tool orders to a post-pandemic low. Key standouts on Tuesday’s calendar come from German inflation, UK employment, German and Eurozone ZEW reads, and US inflation.AUDUSD – technical overview
There are signs of the potential formation of a longer-term base following the late 2022 surge back above 0.6500. Next key resistance comes in at 0.7284. Setbacks should continue to be well supported in the 0.6500 area. Only a monthly close below 0.6500 would give reason for rethink.AUDUSD – fundamental overview
The Australian Dollar has held up well in recent sessions despite a slide in the RMB and metals. A lot of this can be reconciled by the offsetting flow in US equities, which continue to trade to yearly highs. Key standouts on Tuesday’s calendar come from German inflation, UK employment, German and Eurozone ZEW reads, and US inflation.USDCAD – technical overview
A recent surge back above 1.3000 signals an end to a period of bearish consolidation and suggests the market is in the process of carving out a more significant longer-term base. Next key resistance now comes in up into the 1.4000 area. Setbacks should be very well supported down into the 1.3000 area.USDCAD – fundamental overview
It was easy enough to see why the Canadian Dollar sold off hard on Monday, this on the back of a dump in the price of oil. Key standouts on Tuesday’s calendar come from German inflation, UK employment, German and Eurozone ZEW reads, and US inflation.NZDUSD – technical overview
Overall pressure remains on the downside with the market once again stalling out on a run up into the 0.6500 area. Ultimately, a break back above 0.6577 would be required to take the immediate pressure off the downside. A monthly close below 0.6000 would intensify bearish price action.NZDUSD – fundamental overview
Concerns over slowing growth in New Zealand have resulted in a lagging New Zealand Dollar that has also been weighed down by expectations the RBNZ will be leaning more towards accommodation, all while other central banks continue to lean more hawkish. The latest Kiwi data doesn't helped after credit card spending came in soft. At the same time, higher US equities has been helping to offset and drive Kiwi higher. Key standouts on Tuesday’s calendar come from German inflation, UK employment, German and Eurozone ZEW reads, and US inflation.US SPX 500 – technical overview
Longer-term technical studies are in the process of unwinding from extended readings off record highs. Look for rallies to be well capped in favor of lower tops and lower lows. A monthly close back above 4300 will be required at a minimum to take the immediate pressure off the downside. Next key support comes in at 4260.US SPX 500 – fundamental overview
We've finally reached a point in the cycle where the Fed recognizes unanchored inflation expectations pose a greater downside risk than over-tightening. This is significant, as it means less investor friendly monetary policy that risks potential recession in the months ahead. Overall, we expect inflation to continue to be a problem in 2023 that results in downside pressure into rallies.GOLD (SPOT) – technical overview
The 2019 breakout above the 2016 high at 1375 was a significant development, opening the door for fresh record highs. Setbacks should now be well supported above 1600 on a monthly close basis ahead of the next major upside extension. The recent break back above 1808 strengthens the bullish outlook. Next major resistance comes in at 2100, above which opens the next extension towards 2,500.GOLD (SPOT) – fundamental overview
The yellow metal continues to be well supported on dips with solid demand from medium and longer-term accounts. These players are more concerned about inflation risk and a less upbeat global growth outlook. All of this should keep the commodity well supported, with many market participants also fleeing to the hard asset as the grand dichotomy of record high equities and record low yields comes to an unnerving climax.