


Special report: Fed Decision Preview
Today’s report: Market positioned for a less hawkish Fed
It’s been easy enough to reconcile the latest price action in markets. Tuesday’s softer headline US inflation data has reinforced views the Fed will be looking to ease up on its hawkish stance, which has resulted in a lower US Dollar and higher stocks.
Wake-up call
- industrial production
- Strong wages
- energy prices
- Iron ore
- oil jumps
- US stocks
- Inflation headache
- Dealers report
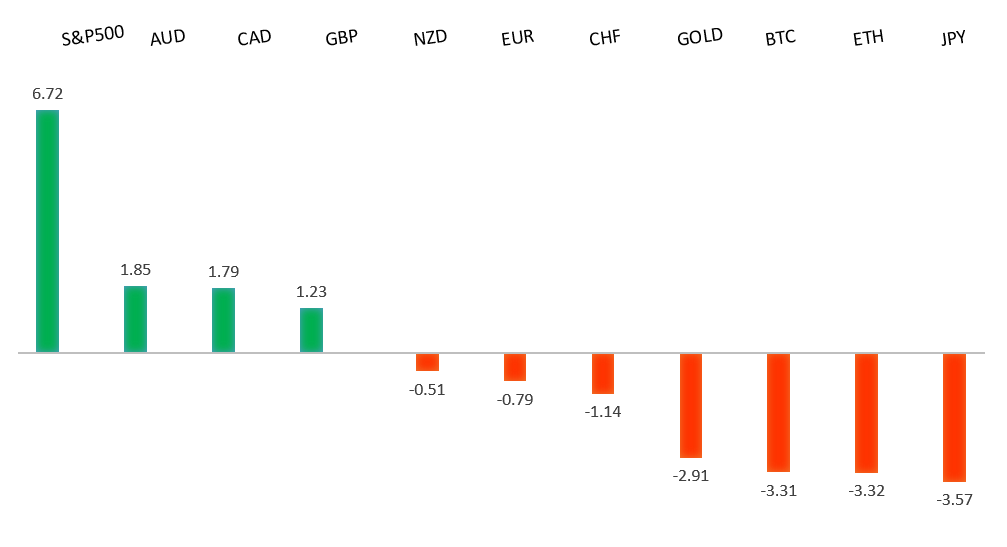
Peformance chart: 30 Day Performance vs. US dollar (%)
Suggested reading
- Your Daily Bread Will Now Come From Fewer Hands, J. Blas, Bloomberg (June 13, 2023)
- Can Hydrogen help the World Reach Net Zero?, S. Mundy, Financial Times (June 14, 2023)
Chart talk: Technical & fundamental highlights
Choose pair:
EURUSD – technical overview
The Euro remains well supported on dips following a run to the topside through 1.1000 earlier this year. Any additional setbacks should be well supported ahead of 1.0500 in favor of the formation of the next major higher low and a bullish continuation. Ultimately, only a monthly close back below 1.0500 would give reason for concern. Next key resistance comes in the form of the March 2022 high at 1.1185.EURUSD – fundamental overview
ZEW reads were mixed on Tuesday, and most of the positive flow into the Euro came from broad based US Dollar selling post softer headline US CPI. Key standouts on Wednesday’s calendar include German wholesale prices, UK GDP, industrial production and trade, Eurozone industrial production, US producer prices, and the Fed decision late in the day.EURUSD - Technical charts in detail
GBPUSD – technical overview
Signs have emerged of the market wanting to put in a longer-term base after collapsing to a record low in September 2022. The November 2022 monthly close back above 1.2000 strengthens this prospect. Any setbacks should now be well supported ahead of 1.2000. Next key resistance comes in at 1.2680.GBPUSD – fundamental overview
Tuesday's strong UK employment data accompanied by another spike in wages was all that was needed to open more upside in the Pound. Additional demand did however come from broad US Dollar selling post a softer headline US inflation print. Key standouts on Wednesday’s calendar include German wholesale prices, UK GDP, industrial production and trade, Eurozone industrial production, US producer prices, and the Fed decision late in the day.USDJPY – technical overview
The major pair has seen a nice recovery following the massive correction out from multi-year highs. Setbacks have finally been well supported ahead of 125.00 in the 127s thus far. At this stage, it looks like the market could be wanting to resume the bigger picture uptrend and head back towards a retest of that multi-year high from October 2022 up at 151.95. Look for any weakness to continue to be well supported in favor of higher lows along the way.USDJPY – fundamental overview
Yield differentials continue to be the main driver of Yen weakness on the back of the monetary policy divergence between the Fed and BOJ. This latest resurgence in energy prices has also played into recent Yen weakness. Key standouts on Wednesday’s calendar include German wholesale prices, UK GDP, industrial production and trade, Eurozone industrial production, US producer prices, and the Fed decision late in the day.AUDUSD – technical overview
There are signs of the potential formation of a longer-term base following the late 2022 surge back above 0.6500. Next key resistance comes in at 0.7284. Setbacks should continue to be well supported in the 0.6500 area. Only a monthly close below 0.6500 would give reason for rethink.AUDUSD – fundamental overview
The Australian Dollar has followed metals higher on the back of the latest China easing. Iron ore just saw its best close in 10 weeks. On the data front, Aussie consumer confidence reads produced a positive read. Key standouts on Wednesday’s calendar include German wholesale prices, UK GDP, industrial production and trade, Eurozone industrial production, US producer prices, and the Fed decision late in the day.USDCAD – technical overview
A recent surge back above 1.3000 signals an end to a period of bearish consolidation and suggests the market is in the process of carving out a more significant longer-term base. Next key resistance now comes in up into the 1.4000 area. Setbacks should be very well supported down into the 1.3000 area.USDCAD – fundamental overview
The Canadian Dollar has been making an impressive run in recent sessions, very much helped along by a strong recovery in the price of oil. Key standouts on Wednesday’s calendar include German wholesale prices, UK GDP, industrial production and trade, Eurozone industrial production, US producer prices, and the Fed decision late in the day.NZDUSD – technical overview
Overall pressure remains on the downside with the market once again stalling out on a run up into the 0.6500 area. Ultimately, a break back above 0.6577 would be required to take the immediate pressure off the downside. A monthly close below 0.6000 would intensify bearish price action.NZDUSD – fundamental overview
Concerns over slowing growth in New Zealand have resulted in a lagging New Zealand Dollar that has also been weighed down by expectations the RBNZ will be leaning more towards accommodation, all while other central banks continue to lean more hawkish. At the same time, higher US equities has been helping to offset and drive Kiwi higher. Key standouts on Wednesday’s calendar include German wholesale prices, UK GDP, industrial production and trade, Eurozone industrial production, US producer prices, and the Fed decision late in the day.US SPX 500 – technical overview
Longer-term technical studies are in the process of unwinding from extended readings off record highs. Look for rallies to be well capped in favor of lower tops and lower lows. A monthly close back above 4300 will be required at a minimum to take the immediate pressure off the downside. Next key support comes in at 4260.US SPX 500 – fundamental overview
We've finally reached a point in the cycle where the Fed recognizes unanchored inflation expectations pose a greater downside risk than over-tightening. This is significant, as it means less investor friendly monetary policy that risks potential recession in the months ahead. Overall, we expect inflation to continue to be a problem in 2023 that results in downside pressure into rallies.GOLD (SPOT) – technical overview
The 2019 breakout above the 2016 high at 1375 was a significant development, opening the door for fresh record highs. Setbacks should now be well supported above 1600 on a monthly close basis ahead of the next major upside extension. The recent break back above 1808 strengthens the bullish outlook. Next major resistance comes in at 2100, above which opens the next extension towards 2,500.GOLD (SPOT) – fundamental overview
The yellow metal continues to be well supported on dips with solid demand from medium and longer-term accounts. These players are more concerned about inflation risk and a less upbeat global growth outlook. All of this should keep the commodity well supported, with many market participants also fleeing to the hard asset as the grand dichotomy of record high equities and record low yields comes to an unnerving climax.