


Next 24 hours: US market out in observance of holiday
Today’s report: Hard to ignore the Fed
The message into the end of last week came loud and clear from a number of Fed officials. Much to the market’s discontent, the Fed continued to lean hawkish, talking the need for more rate hikes ahead.
Wake-up call
- dovish Villeroy
- BOE repricing
- YCC policy
- hike odds
- BoC expectations
- PMI survey
- Inflation headache
- Dealers report
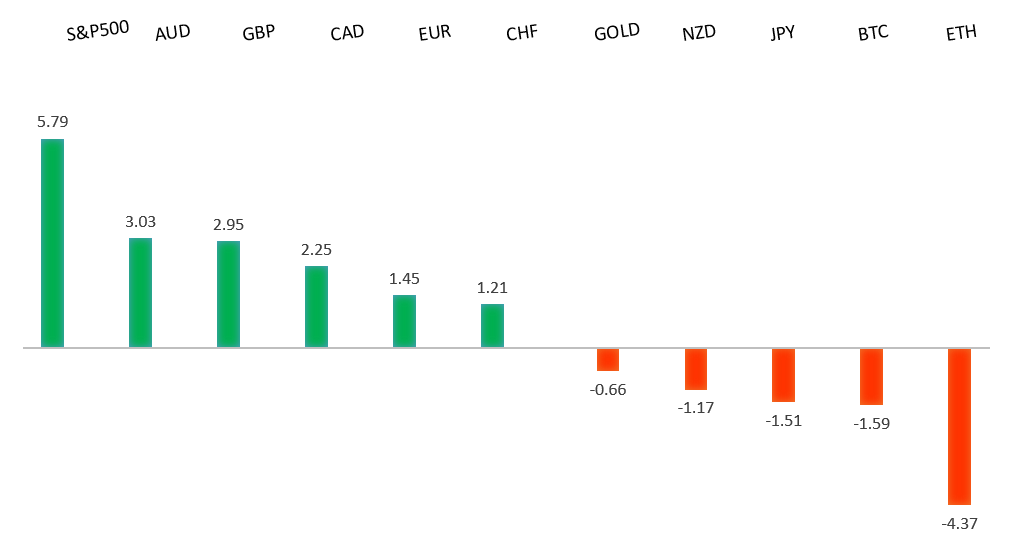
Peformance chart: 30 Day Performance vs. US dollar (%)
Suggested reading
- Global Trade Needs Some Help as China Stumbles, C. Whiteaker, Bloomberg (June 19, 2023)
- The Week That Was In the Broad Markets, J. Calhoun, Alhambra Investments (June 11, 2023)
Chart talk: Technical & fundamental highlights
Choose pair:
EURUSD – technical overview
The Euro remains well supported on dips following a run to the topside through 1.1000 earlier this year. Any additional setbacks should be well supported ahead of 1.0500 in favor of the formation of the next major higher low and a bullish continuation. Ultimately, only a monthly close back below 1.0500 would give reason for concern. Next key resistance comes in the form of the March 2022 high at 1.1185.EURUSD – fundamental overview
The Euro slumped into the end of last week after ECB Villeroy delivered dovish comments. Villeroy said inflation has peaked and the ECB has covered most of the ground on rates. Looking ahead, Monday’s docket is exceptionally thin on account of some holiday trade. Canada producer prices and NAHB housing are the only notable standouts.EURUSD - Technical charts in detail
GBPUSD – technical overview
Signs have emerged of the market wanting to put in a longer-term base after collapsing to a record low in September 2022. The November 2022 monthly close back above 1.2000 strengthens this prospect. Any setbacks should now be well supported ahead of 1.2000. Next key resistance comes in at 1.3000.GBPUSD – fundamental overview
The Pound has been one of the stronger currencies of late, getting a big boost from a hawkish repricing of BOE rate expectations. Last week's solid UK employment data accompanied by an ongoing rise in wages has solidified this outlook. Looking ahead, Monday’s docket is exceptionally thin on account of some holiday trade. Canada producer prices and NAHB housing are the only notable standouts.USDJPY – technical overview
The major pair has seen a nice recovery following the massive correction out from multi-year highs. Setbacks have finally been well supported ahead of 125.00 in the 127s thus far. At this stage, it looks like the market could be wanting to resume the bigger picture uptrend and head back towards a retest of that multi-year high from October 2022 up at 151.95. Look for any weakness to continue to be well supported in favor of higher lows along the way.USDJPY – fundamental overview
The BOJ kept with negative interest rates and yield curve control policy, and the market has all but lost confidence in the prospect of the BOJ ever considering a shift in policy. All of this comes at a time where the outlook at the Fed is decidedly more hawkish, which has been behind a lot of the Yen weakness we've been seeing. Looking ahead, Monday’s docket is exceptionally thin on account of some holiday trade. Canada producer prices and NAHB housing are the only notable standouts.AUDUSD – technical overview
There are signs of the potential formation of a longer-term base following the late 2022 surge back above 0.6500. Next key resistance comes in at 0.7284. Setbacks should continue to be well supported in the 0.6500 area. Only a monthly close below 0.6500 would give reason for rethink.AUDUSD – fundamental overview
The Australian Dollar has run into a round of profit taking after a solid performance, with the setbacks coming mostly from a reversal in US equities and downturn in risk sentiment into the end of last week. The odds of an RBA hike in July are now slightly better than 50%. Looking ahead, Monday’s docket is exceptionally thin on account of some holiday trade. Canada producer prices and NAHB housing are the only notable standouts.USDCAD – technical overview
Above 1.3000 signals an end to a period of longer-term bearish consolidation and suggests the market is in the process of carving out a more significant longer-term base. Next key resistance now comes in up into the 1.4000 area. Setbacks should be very well supported down into the 1.3000 area.USDCAD – fundamental overview
The Canadian Dollar has continued to run hot as rate hike odds ramped up in Canada. Market odds for a July Bank of Canada hike now trade near 70%. Looking ahead, Monday’s docket is exceptionally thin on account of some holiday trade. Canada producer prices and NAHB housing are the only notable standouts.NZDUSD – technical overview
Overall pressure remains on the downside with the market once again stalling out on a run up into the 0.6500 area. Ultimately, a break back above 0.6577 would be required to take the immediate pressure off the downside. A monthly close below 0.6000 would intensify bearish price action.NZDUSD – fundamental overview
The New Zealand Dollar has pulled back after the latest New Zealand PMI data remains in contraction territory. We've also seen profit taking on a turnaround in US equities as sentiment turns south. Looking ahead, Monday’s docket is exceptionally thin on account of some holiday trade. Canada producer prices and NAHB housing are the only notable standouts.US SPX 500 – technical overview
Longer-term technical studies are in the process of unwinding from extended readings off record highs. Look for rallies to be well capped in favor of lower tops and lower lows. A monthly close back above 4400 will be required to take the immediate pressure off the downside. Next key support comes in at 4260.US SPX 500 – fundamental overview
We've finally reached a point in the cycle where the Fed recognizes unanchored inflation expectations pose a greater downside risk than over-tightening. This is significant, as it means less investor friendly monetary policy that risks potential recession in the months ahead. Overall, we expect inflation to continue to be a problem in 2023 that results in downside pressure into rallies despite market expectations that would argue otherwise.GOLD (SPOT) – technical overview
The 2019 breakout above the 2016 high at 1375 was a significant development, opening the door for fresh record highs. Setbacks should now be well supported above 1600 on a monthly close basis ahead of the next major upside extension. The recent break back above 1808 strengthens the bullish outlook. Next major resistance comes in at 2100, above which opens the next extension towards 2,500.GOLD (SPOT) – fundamental overview
The yellow metal continues to be well supported on dips with solid demand from medium and longer-term accounts. These players are more concerned about inflation risk and a less upbeat global growth outlook. All of this should keep the commodity well supported, with many market participants also fleeing to the hard asset as the grand dichotomy of record high equities and record low yields comes to an unnerving climax.