


Special report: BOE Decision Preview
Today’s report: China outlook sours
The deterioration in Chinese markets this week has been weighing on global sentiment, clearly reflected in the pullback in US equities. Investors have been vocal about their disappointment with the rollout of stimulus in China.
Wake-up call
- ECB Kazimir
- core CPI
- BOJ Ueda
- leading index
- retail sales
- consumer confidence
- Inflation headache
- Dealers report
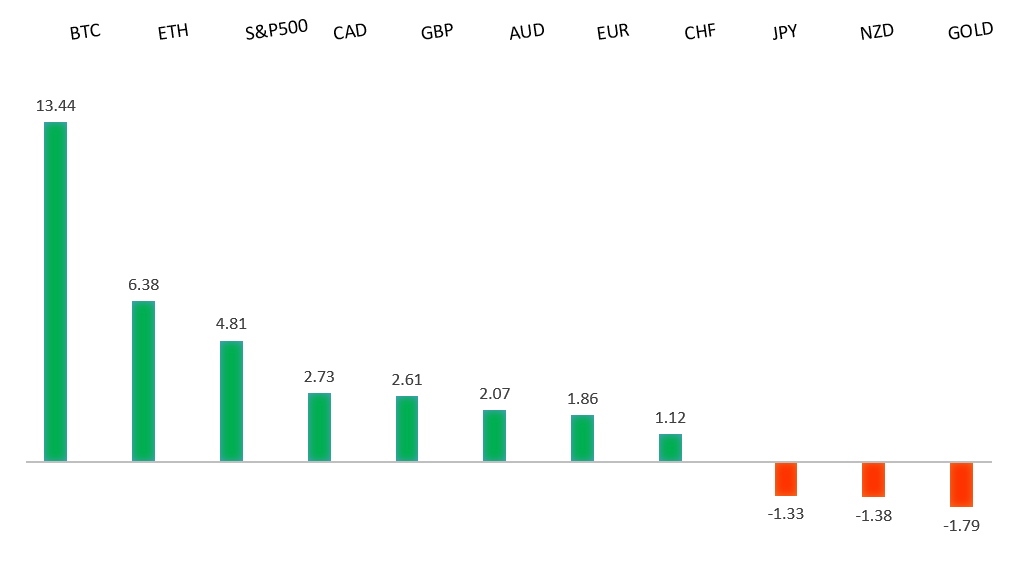
Peformance chart: 30 Day Performance vs. US dollar (%)
Suggested reading
- This Bank of England Policy Meeting Will Be Excruciating, J. Authers, Bloomberg (June 22, 2023)
- Desperately Seeking A Soft Landing, L. Ashworth, FT Alphaville (June 19, 2023)
Chart talk: Technical & fundamental highlights
Choose pair:
EURUSD – technical overview
The Euro remains well supported on dips following a run to the topside through 1.1000 earlier this year. Any additional setbacks should be well supported ahead of 1.0500 in favor of the formation of the next major higher low and a bullish continuation. Ultimately, only a monthly close back below 1.0500 would give reason for concern. Next key resistance comes in the form of the March 2022 high at 1.1185.EURUSD – fundamental overview
ECB Kazimir was the latest hawkish central banker to hit the wires, saying he doesn't expect inflation to drop. This helped to run the Euro up to multi-session highs. Key standouts on Thursday’s calendar include the BOE policy decision, US initial jobless claims, more Fed Powell testimony, and US existing home sales.EURUSD - Technical charts in detail
GBPUSD – technical overview
Signs have emerged of the market wanting to put in a longer-term base after collapsing to a record low in September 2022. The November 2022 monthly close back above 1.2000 strengthens this prospect. Any setbacks should now be well supported ahead of 1.2000. Next key resistance comes in at 1.3000.GBPUSD – fundamental overview
The Pound took a hit on Wednesday despite the hotter headline inflation data. We believe worry around the impact of higher rates on the economy and some offsetting softer inflation components were ultimately behind the selling. Core CPI rose to the highest level since 1992. Meanehile, PSNB revealed UK debt to GDP exceeding 100% the highest since 1961. Key standouts on Thursday’s calendar include the BOE policy decision, US initial jobless claims, more Fed Powell testimony, and US existing home sales.USDJPY – technical overview
The major pair has seen a nice recovery following the massive correction out from multi-year highs. Setbacks have finally been well supported ahead of 125.00 in the 127s thus far. At this stage, it looks like the market could be wanting to resume the bigger picture uptrend and head back towards a retest of that multi-year high from October 2022 up at 151.95. Look for any weakness to continue to be well supported in favor of higher lows along the way.USDJPY – fundamental overview
The Yen put in another yearly low against the Buck on Wednesday as yield differentials continued to weigh on the currency. BOJ Ueda said he expected prices to slow in the coming months are remained committed to monetary easing. Key standouts on Thursday’s calendar include the BOE policy decision, US initial jobless claims, more Fed Powell testimony, and US existing home sales.AUDUSD – technical overview
There are signs of the potential formation of a longer-term base following the late 2022 surge back above 0.6500. Next key resistance comes in at 0.7284. Setbacks should continue to be well supported in the 0.6500 area. Only a monthly close below 0.6500 would give reason for rethink.AUDUSD – fundamental overview
The Australian Dollar has come under pressure in recent sessions on the more dovish RBA Minutes earlier this week and on the Westpac leading index slumping to its lowest level since August. Key standouts on Thursday’s calendar include the BOE policy decision, US initial jobless claims, more Fed Powell testimony, and US existing home sales.USDCAD – technical overview
Above 1.3000 signals an end to a period of longer-term bearish consolidation and suggests the market is in the process of carving out a more significant longer-term base. Next key resistance now comes in up into the 1.4000 area. Setbacks should be very well supported down into the 1.3000 area.USDCAD – fundamental overview
Canada retail sales came in above forecast and the price of oil rallied back to the topside, resulting in Canadian Dollar outperformance and a fresh yearly high against the Buck. Key standouts on Thursday’s calendar include the BOE policy decision, US initial jobless claims, more Fed Powell testimony, and US existing home sales.NZDUSD – technical overview
Overall pressure remains on the downside with the market once again stalling out on a run up into the 0.6500 area. Ultimately, a break back above 0.6577 would be required to take the immediate pressure off the downside. A monthly close below 0.6000 would intensify bearish price action.NZDUSD – fundamental overview
The New Zealand Dollar has been holding up better than its peers in recent sessions, getting a boost from better than expected New Zealand consumer confidence data earlier in the week. Westpac Q2 consumer confidence rose from 77.7 to 83.1. Key standouts on Thursday’s calendar include the BOE policy decision, US initial jobless claims, more Fed Powell testimony, and US existing home sales.US SPX 500 – technical overview
Longer-term technical studies are in the process of unwinding from extended readings off record highs. Look for rallies to be well capped in favor of lower tops and lower lows. A monthly close back above 4400 will be required to take the immediate pressure off the downside. Next key support comes in at 4260.US SPX 500 – fundamental overview
We've finally reached a point in the cycle where the Fed recognizes unanchored inflation expectations pose a greater downside risk than over-tightening. This is significant, as it means less investor friendly monetary policy that risks potential recession in the months ahead. Overall, we expect inflation to continue to be a problem in 2023 that results in downside pressure into rallies despite market expectations that would argue otherwise.GOLD (SPOT) – technical overview
The 2019 breakout above the 2016 high at 1375 was a significant development, opening the door for fresh record highs. Setbacks should now be well supported above 1600 on a monthly close basis ahead of the next major upside extension. The recent break back above 1808 strengthens the bullish outlook. Next major resistance comes in at 2100, above which opens the next extension towards 2,500.GOLD (SPOT) – fundamental overview
The yellow metal continues to be well supported on dips with solid demand from medium and longer-term accounts. These players are more concerned about inflation risk and a less upbeat global growth outlook. All of this should keep the commodity well supported, with many market participants also fleeing to the hard asset as the grand dichotomy of record high equities and record low yields comes to an unnerving climax.