


Next 24 hours: Thinner conditions ahead on account of US holiday
Today’s report: Markets feel good about easing of key Fed inflation gauge
Fears of any recession in the US have all but faded away and the market continues to feel good about buying into risk assets. US equities have extended their impressive run to fresh yearly highs, getting another boost from Friday’s softer core PCE read, with the deflator falling to its lowest level since April 2021.
Wake-up call
- CPI uptick
- Upwards revisions
- BOJ Himino
- Risk-on flow
- GDP miss
- Macro flows
- Inflation headache
- Dealers report
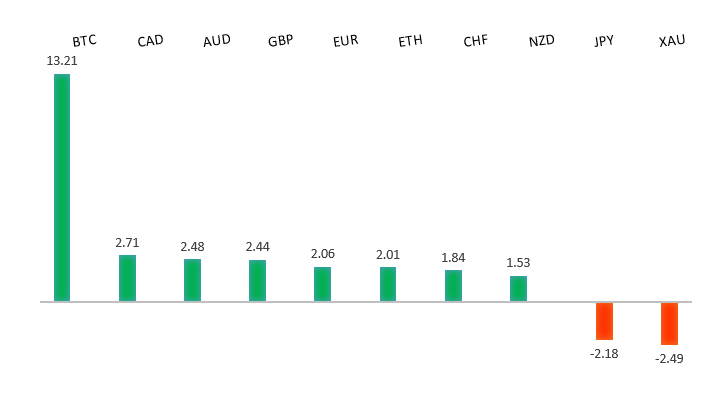
Peformance chart: 30 Day Performance vs. US dollar (%)
Suggested reading
- The Rocket’s Red Glare, the Consumer’s Still There, J. Authers, Bloomberg (June 30, 2023)
- The Cost of Food Fraud Scandals, M. Speed, Financial Times (July 1, 2023)
Chart talk: Technical & fundamental highlights
Choose pair:
EURUSD – technical overview
The Euro remains well supported on dips following a run to the topside through 1.1000 earlier this year. Any additional setbacks should be well supported ahead of 1.0500 in favor of the formation of the next major higher low and a bullish continuation. Ultimately, only a monthly close back below 1.0500 would give reason for concern. Next key resistance comes in the form of the March 2022 high at 1.1185.EURUSD – fundamental overview
The Euro put in an impressive recovery into the end of the week, despite softer German import prices and a slide in German retail sales. It seems the bigger focus was on the inflation data, after Eurozone core CPI saw an uptick. Key standouts on Monday’s calendar come from Aussie building permits, PMI reads out of Germany, the Eurozone, and UK, and US ISM manufacturing and construction spending.EURUSD - Technical charts in detail
GBPUSD – technical overview
Signs have emerged of the market wanting to put in a longer-term base after collapsing to a record low in September 2022. The November 2022 monthly close back above 1.2000 strengthens this prospect. Any setbacks should now be well supported ahead of 1.2000. Next key resistance comes in at 1.3000.GBPUSD – fundamental overview
On Friday, UK Q1 gross capital formation, exports, imports, and business investment were all revised meaningfully higher which helped to drive a healthy recovery in the Pound. Key standouts on Monday’s calendar come from Aussie building permits, PMI reads out of Germany, the Eurozone, and UK, and US ISM manufacturing and construction spending.USDJPY – technical overview
The major pair has seen a nice recovery following the massive correction out from multi-year highs. Setbacks have finally been well supported ahead of 125.00 in the 127s thus far. At this stage, it looks like the market could be wanting to resume the bigger picture uptrend and head back towards a retest of that multi-year high from October 2022 up at 151.95. Look for any weakness to continue to be well supported in favor of higher lows along the way.USDJPY – fundamental overview
Finally some strength in a very beaten down Yen. We believe this was attributed to a rise in Japan CPI and surging Japan housing starts. We also heard from BOJ deputy governor Himino who said he saw early signs of demand driven inflation. Key standouts on Monday’s calendar come from Aussie building permits, PMI reads out of Germany, the Eurozone, and UK, and US ISM manufacturing and construction spending.AUDUSD – technical overview
There are signs of the potential formation of a longer-term base following the late 2022 surge back above 0.6500. Next key resistance comes in at 0.7284. Setbacks should continue to be well supported in the 0.6500 area. Only a monthly close below 0.6500 would give reason for rethink.AUDUSD – fundamental overview
Aussie private sector credit cooled off a bit, though this wasn't enough to stop the market from buying the Australian Dollar on the back of broad based risk on flow. Key standouts on Monday’s calendar come from Aussie building permits, PMI reads out of Germany, the Eurozone, and UK, and US ISM manufacturing and construction spending.USDCAD – technical overview
Above 1.3000 signals an end to a period of longer-term bearish consolidation and suggests the market is in the process of carving out a more significant longer-term base. Next key resistance now comes in up into the 1.4000 area. Setbacks should be very well supported down into the 1.3000 area.USDCAD – fundamental overview
The Canadian Dollar was a clear underperformer to close out the previous week, taking a hit on a less impressive Canada GDP print. Key standouts on Monday’s calendar come from Aussie building permits, PMI reads out of Germany, the Eurozone, and UK, and US ISM manufacturing and construction spending.NZDUSD – technical overview
Overall pressure remains on the downside with the market once again stalling out on a run up into the 0.6500 area. Ultimately, a break back above 0.6577 would be required to take the immediate pressure off the downside. A monthly close below 0.6000 would intensify bearish price action.NZDUSD – fundamental overview
Most of this latest impressive recovery in the price of the New Zealand Dollar comes from upbeat global risk sentiment and higher equities. Key standouts on Monday’s calendar come from Aussie building permits, PMI reads out of Germany, the Eurozone, and UK, and US ISM manufacturing and construction spending.US SPX 500 – technical overview
Longer-term technical studies are in the process of unwinding from extended readings off record highs. Look for rallies to be well capped in favor of lower tops and lower lows. A monthly close back above 4400 will be required to take the immediate pressure off the downside. Next key support comes in at 4260.US SPX 500 – fundamental overview
We've finally reached a point in the cycle where the Fed recognizes unanchored inflation expectations pose a greater downside risk than over-tightening. This is significant, as it means less investor friendly monetary policy that risks potential recession in the months ahead. Overall, we expect inflation to continue to be a problem in 2023 that results in downside pressure into rallies despite market expectations that would argue otherwise.GOLD (SPOT) – technical overview
The 2019 breakout above the 2016 high at 1375 was a significant development, opening the door for fresh record highs. Setbacks should now be well supported above 1600 on a monthly close basis ahead of the next major upside extension. The recent break back above 1808 strengthens the bullish outlook. Next major resistance comes in at 2100, above which opens the next extension towards 2,500.GOLD (SPOT) – fundamental overview
The yellow metal continues to be well supported on dips with solid demand from medium and longer-term accounts. These players are more concerned about inflation risk and a less upbeat global growth outlook. All of this should keep the commodity well supported, with many market participants also fleeing to the hard asset as the grand dichotomy of record high equities and record low yields comes to an unnerving climax.