


Next 24 hours: Dollar extends declines, stocks keep running higher
Today’s report: No major surprises from Fed; ECB decision ahead
We didn’t get much in the way of a surprise from the Fed on Wednesday. The central bank went ahead and raised rates by 25 basis points as widely expected, while at the same time, still not giving up on the possibility for additional rate hikes in 2023.
Wake-up call
- LVMH results
- BOE pricing
- Hawkish IMF
- Rio Tinto
- Oil retreat
- USD selling
- inflation risk
- Dealers report
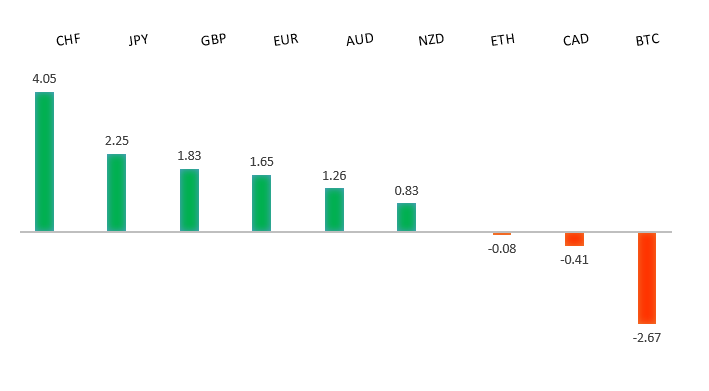
Peformance chart: 30 Day Performance vs. US dollar (%)
Suggested reading
- Markets Hope for Decisive China Changes. Are They?, J. Authers, Bloomberg (July 26, 2023)
- Ukraine's Tech Sector Goes to War, J. Sinclair, Financial Times (July 26, 2023)
Chart talk: Technical & fundamental highlights
Choose pair:
EURUSD – technical overview
The Euro remains well supported on dips following a run to the topside through 1.1000 earlier this year. Any additional setbacks should be well supported ahead of 1.0500 in favor of a bullish continuation. Ultimately, only a monthly close back below 1.0500 would give reason for concern. Next key resistance comes in the form of the February 2022 high at 1.1496.EURUSD – fundamental overview
The Euro did a good job shrugging off discouraging LVMH results and a downturn in European equities, with the currency more focused on a post-Fed decision US Dollar sell-off. Key standouts on Thursday’s calendar come from German consumer confidence reads, UK CBI trades, the ECB policy decision, US GDP, durable goods, initial jobless claims, and pending home sales.EURUSD - Technical charts in detail
GBPUSD – technical overview
Signs have emerged of the market wanting to put in a longer-term base after collapsing to a record low in September 2022. The November 2022 monthly close back above 1.2000 strengthens this prospect. Any setbacks should now be well supported ahead of 1.2000. Next key resistance comes in at 1.3500.GBPUSD – fundamental overview
The Pound extended the run back to the topside on Wednesday, getting help from yield differentials post Fed decision. Odds of a larger 50 basis point August BOE hike trade around 45%, which compares favorably to the Fed. Key standouts on Thursday’s calendar come from German consumer confidence reads, UK CBI trades, the ECB policy decision, US GDP, durable goods, initial jobless claims, and pending home sales.USDJPY – technical overview
The major pair has seen a nice recovery following the massive correction out from multi-year highs. Setbacks have finally been well supported ahead of 125.00 in the 127s thus far. At this stage, it looks like the market could be wanting to resume the bigger picture uptrend and head back towards a retest of that multi-year high from October 2022 up at 151.95. Look for any weakness to continue to be well supported ahead of 135.00 in favor of the next higher low.USDJPY – fundamental overview
There was a decent amount of demand for the Yen on Wednesday, with the currency rallying on hawkish IMF statements. The IMF suggested the BOJ should move away from yield curve control and prepare for tighter policy. Key standouts on Thursday’s calendar come from German consumer confidence reads, UK CBI trades, the ECB policy decision, US GDP, durable goods, initial jobless claims, and pending home sales.AUDUSD – technical overview
There are signs of the potential formation of a longer-term base following the late 2022 surge back above 0.6500. Next key resistance comes in at 0.7284. Setbacks should continue to be well supported in the 0.6500 area. Only a monthly close below 0.6500 would give reason for rethink.AUDUSD – fundamental overview
The Australian Dollar had a hard time dealing with Wednesday's softer than expected Aussie CPI data. Odds for an August RBA hike have now fallen to 25% from 60% last week. Another weight on Aussie was the news of Rio Tinto cutting its dividend. Key standouts on Thursday’s calendar come from German consumer confidence reads, UK CBI trades, the ECB policy decision, US GDP, durable goods, initial jobless claims, and pending home sales.USDCAD – technical overview
Above 1.3000 signals an end to a period of longer-term bearish consolidation and suggests the market is in the process of carving out a more significant longer-term base. Next key resistance now comes in up into the 1.4000 area. Setbacks should be very well supported down into the 1.3000 area.USDCAD – fundamental overview
The Canadian Dollar sold off on Wednesday, mostly on the back of some weakness in the price of oil. Key standouts on Thursday’s calendar come from German consumer confidence reads, UK CBI trades, the ECB policy decision, US GDP, durable goods, initial jobless claims, and pending home sales.NZDUSD – technical overview
Overall pressure remains on the downside with the market once again stalling out on a run up into the 0.6500 area. Ultimately, a break back above 0.6577 would be required to take the immediate pressure off the downside. A monthly close below 0.6000 would intensify bearish price action.NZDUSD – fundamental overview
The New Zealand Dollar traded a little higher on Wednesday, mostly on the back of a round of post-Fed US Dollar selling. At the same time, some downside pressure in stocks kept the currency capped into rallies. Key standouts on Thursday’s calendar come from German consumer confidence reads, UK CBI trades, the ECB policy decision, US GDP, durable goods, initial jobless claims, and pending home sales.US SPX 500 – technical overview
Longer-term technical studies are in the process of unwinding from extended readings off record highs. Look for rallies to be well capped in favor of lower tops and lower lows. A monthly close back above 4600 will be required to take the immediate pressure off the downside. Next key support comes in at 4376.US SPX 500 – fundamental overview
We've finally reached a point in the cycle where the Fed recognizes unanchored inflation expectations pose a greater downside risk than over-tightening. This is significant, as it means less investor friendly monetary policy that risks potential recession in the months ahead. Overall, we expect inflation to continue to be a problem in 2023 that results in downside pressure into rallies despite market expectations that would argue otherwise in the face of the latest pullback in inflation.GOLD (SPOT) – technical overview
The 2019 breakout above the 2016 high at 1375 was a significant development, opening the door for fresh record highs. Setbacks should now be well supported above 1600 on a monthly close basis ahead of the next major upside extension. The recent break back above 1808 strengthens the bullish outlook. Next major resistance comes in at 2100, above which opens the next extension towards 2,500.GOLD (SPOT) – fundamental overview
The yellow metal continues to be well supported on dips with solid demand from medium and longer-term accounts. These players are more concerned about inflation risk and a less upbeat global growth outlook. All of this should keep the commodity well supported, with many market participants also fleeing to the hard asset as the grand dichotomy of record high equities and record low yields comes to an unnerving climax.