


Special report: FOMC Minutes Preview
Today’s report: Making sense of the Tuesday price action
Tuesday was an interesting day for financial markets. First off, given the robust US retail sales print, which sent the Atlanta Fed’s GDP tracker surging to 5%, one would have thought front-end rates would have been higher on the day, not lower.
Wake-up call
- ZEW reads
- peak rate
- still doubting
- China woes
- Slumping oil
- RBNZ decision
- inflation risk
- Dealers report
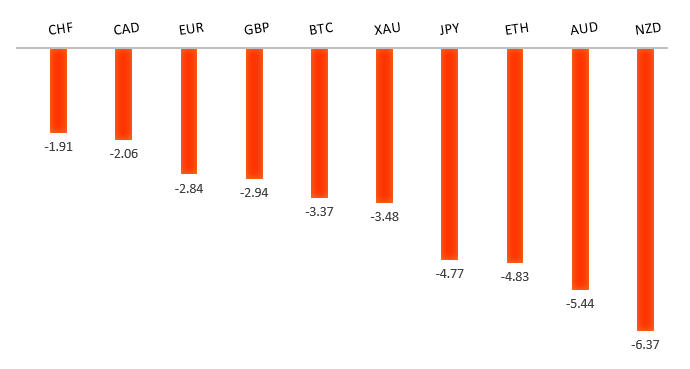
Peformance chart: 30 Day Performance vs. US dollar (%)
Suggested reading
- Corporate Failure Is a Valuable Asset That’s Hard to Protect, A. Brown, Bloomberg (August 15, 2023)
- "More Room For the Fed to Cut" Is a Ridiculous Approach, J. Calhoun, Alhambra (August 14, 2023)
Chart talk: Technical & fundamental highlights
Choose pair:
EURUSD – technical overview
The Euro remains well supported on dips following a run to the topside through 1.1000. Any additional setbacks should be well supported ahead of 1.0500 in favor of a bullish continuation. Ultimately, only a monthly close back below 1.0500 would give reason for concern. Next key resistance comes in the form of the 2023 high at 1.1276.EURUSD – fundamental overview
Macro forces weighed on risk sentiment in Tuesday trade, which opened broad based US Dollar demand. At the same time, Euro setbacks were mitigated by less bad German ZEW reads and an improvement in Eurozone ZEW. Key standouts on Wednesday’s calendar come from UK inflation, Eurozone industrial production, employment, and GDP, Canada housing starts and wholesale sales, US building permits, housing starts, industrial production, manufacturing production, and the Fed Minutes late in the day.EURUSD - Technical charts in detail
GBPUSD – technical overview
Signs have emerged of the market wanting to put in a longer-term base after collapsing to a record low in September 2022. The November 2022 monthly close back above 1.2000 strengthens this prospect. Any setbacks should now be well supported ahead of 1.2500. Next key resistance comes in at 1.3143.GBPUSD – fundamental overview
The Pound managed to close higher and outperform on the day, with a strong UK employment report, highlighted by above forecast wage growth fueling BOE rate expectations. The implied peak rate in the UK has risen to 5.92% from 5.66% last week. Key standouts on Wednesday’s calendar come from UK inflation, Eurozone industrial production, employment, and GDP, Canada housing starts and wholesale sales, US building permits, housing starts, industrial production, manufacturing production, and the Fed Minutes late in the day.USDJPY – technical overview
The major pair has seen a nice recovery following the massive correction out from multi-year highs. Setbacks have finally been well supported ahead of 125.00 in the 127s. At this stage, it looks like the market could be wanting to resume the bigger picture uptrend and head back towards a retest of that multi-year high from October 2022 up at 151.95. Look for any weakness to continue to be well supported on dips. A weekly close back above 145.00 will confirm bullish continuation.USDJPY – fundamental overview
Japan GDP more than doubled expectation on Tuesday, while industrial production was also revised up. But in the end, the Yen still managed to extend to a fresh yearly low against the Buck, with the data only perhaps slowing the pace of the Yen decline just a bit. Overall, the market doesn't believe any of this will force the BOJ into tighter monetary policy. Key standouts on Wednesday’s calendar come from UK inflation, Eurozone industrial production, employment, and GDP, Canada housing starts and wholesale sales, US building permits, housing starts, industrial production, manufacturing production, and the Fed Minutes late in the day.AUDUSD – technical overview
There are signs of the potential formation of a longer-term base following the late 2022 surge back above 0.6500. Next key resistance comes in at 0.7284. Setbacks should continue to be well supported in the 0.6400-6500 area. Only a monthly close below 0.6500 would give reason for rethink.AUDUSD – fundamental overview
The Australian Dollar extended its run of fresh 2023 lows on the back of ongoing fears over the outlook for China, a more dovish leaning RBA Minutes, and a downtick in the Aussie wage price index. On Tuesday, in an unsettling move, the Chinese government decided to halt its regular report on youth unemployment after hitting a record 21.3% in June. Key standouts on Wednesday’s calendar come from UK inflation, Eurozone industrial production, employment, and GDP, Canada housing starts and wholesale sales, US building permits, housing starts, industrial production, manufacturing production, and the Fed Minutes late in the day.USDCAD – technical overview
Above 1.3000 signals an end to a period of longer-term bearish consolidation and suggests the market is in the process of carving out a more significant longer-term base. Next key resistance now comes in up into the 1.4000 area. Setbacks should be very well supported down into the 1.3000 area.USDCAD – fundamental overview
A worsening global macro condition and slumping oil prices were enough to more than offset any Canadian Dollar demand from hotter than forecast Canada inflation data. Still, odds for a Bank of Canada rate hike in September have risen to 30% from around 20% on Monday. Key standouts on Wednesday’s calendar come from UK inflation, Eurozone industrial production, employment, and GDP, Canada housing starts and wholesale sales, US building permits, housing starts, industrial production, manufacturing production, and the Fed Minutes late in the day.NZDUSD – technical overview
Overall pressure remains on the downside with the market once again stalling out on a run up into the 0.6500 area. Ultimately, a break back above 0.6577 would be required to take the immediate pressure off the downside. A monthly close below 0.6000 would intensify bearish price action.NZDUSD – fundamental overview
The New Zealand Dollar trades down at yearly lows on the back of an ongoing deterioration in sentiment, falling stocks and commodities, and soft New Zealand PMI data the other day. The local rate market in New Zealand sees zero chance for an RBNZ hike early Wednesday. Key standouts on Wednesday’s calendar come from the RBNZ policy decision, UK inflation, Eurozone industrial production, employment, and GDP, Canada housing starts and wholesale sales, US building permits, housing starts, industrial production, manufacturing production, and the Fed Minutes late in the day.US SPX 500 – technical overview
Longer-term technical studies are in the process of unwinding from extended readings off record highs. Look for rallies to be well capped in favor of lower tops and lower lows. A monthly close back above 4600 will be required to take the immediate pressure off the downside. Next key support comes in at 4376.US SPX 500 – fundamental overview
We've finally reached a point in the cycle where the Fed recognizes unanchored inflation expectations pose a greater downside risk than over-tightening. This is significant, as it means less investor friendly monetary policy. Overall, we expect inflation to continue to be a problem in 2023 that results in downside pressure into rallies despite market expectations that would argue otherwise.GOLD (SPOT) – technical overview
The 2019 breakout above the 2016 high at 1375 was a significant development, opening the door for fresh record highs. Setbacks should now be well supported above 1600 on a monthly close basis ahead of the next major upside extension. The recent break back above 1808 strengthens the bullish outlook. Next major resistance comes in at 2100, above which opens the next extension towards 2500.GOLD (SPOT) – fundamental overview
The yellow metal continues to be well supported on dips with solid demand from medium and longer-term accounts. These players are more concerned about inflation risk and a less upbeat global growth outlook. All of this should keep the commodity well supported, with many market participants also fleeing to the hard asset as the grand dichotomy of record high equities and record low yields comes to an unnerving climax.