


Special report: Why crypto rallied
Today’s report: The market sees what it wants to see
One of the consistent themes in financial markets is the theme of investors wanting to see what they want to see, despite any messages that might suggest otherwise. For much of 2023, there has been a clear message from the Federal Reserve that inflation is a risk it is very much concerned about and additional rate hikes remain on the table.
Wake-up call
- Hawkish ECB
- USD outflows
- white paper
- RBA Bullock
- Commodities recovery
- IMF report
- inflation risk
- Dealers report
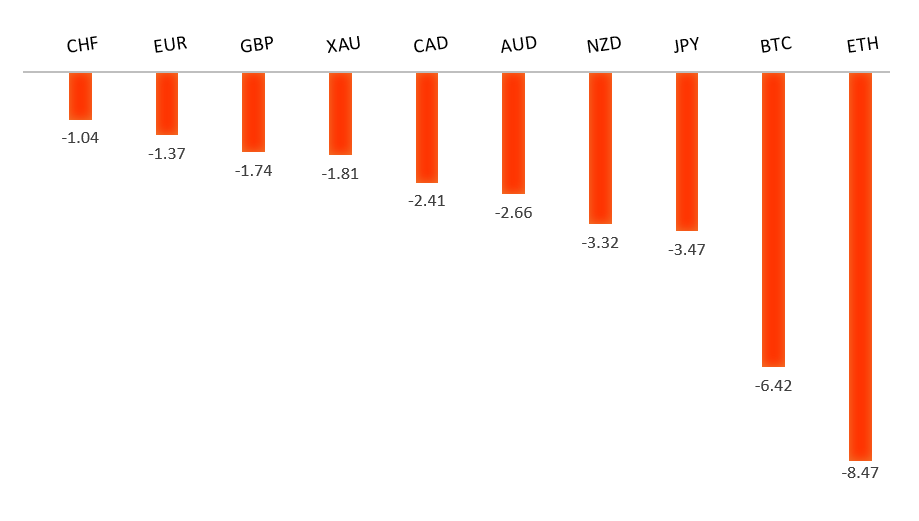
Peformance chart: 30 Day Performance vs. US dollar (%)
Suggested reading
- Japanification? China Should Be So Lucky, G. Reidy, Bloomberg (August 29, 2023)
- 'R-Star' Is What the Fed Can't Measure or Control, J. Calhoun, Alhambra (August 23, 2023)
Chart talk: Technical & fundamental highlights
Choose pair:
EURUSD – technical overview
The Euro remains well supported on dips following a run to the topside through 1.1000. Any additional setbacks should be well supported ahead of 1.0500 in favor of a bullish continuation. Ultimately, only a monthly close back below 1.0500 would give reason for concern. Next key resistance comes in the form of the 2023 high at 1.1276.EURUSD – fundamental overview
Despite some softer economic data out of the zone, the Euro has managed to recover this week on the back of hawkish ECB comments, and some broad based US Dollar selling. Key standouts on Wednesday’s calendar come from German inflation reads, BOE consumer credit and mortgage approvals, Eurozone sentiment and confidence reads, US ADP employment, GDP, and pending homes sales.EURUSD - Technical charts in detail
GBPUSD – technical overview
Signs have emerged of the market wanting to put in a longer-term base after collapsing to a record low in September 2022. The November 2022 monthly close back above 1.2000 strengthens this prospect. Any setbacks should now be well supported ahead of 1.2500. Next key resistance comes in at 1.3143.GBPUSD – fundamental overview
Absence of economic data out of the UK in the early week has kept the focus on more hawkish BOE comments and broad based US Dollar outflows. Key standouts on Wednesday’s calendar come from German inflation reads, BOE consumer credit and mortgage approvals, Eurozone sentiment and confidence reads, US ADP employment, GDP, and pending homes sales.USDJPY – technical overview
At this stage, it looks like the market is wanting to resume the bigger picture uptrend and head back towards a retest of that multi-year high from October 2022 up at 151.95. Look for any weakness to continue to be well supported on dips.USDJPY – fundamental overview
The Yen put in a recovery on Tuesday after sinking to yet another yearly low against the Buck. Overall, there continues to be plenty of sell interest in the Yen into rallies, though worry over possible intervention and the Japanese annual white paper outlining a possible turning point in a 25 year battle with deflation, have inspired some of this wave of demand we've seen over the past 24 hours. Key standouts on Wednesday’s calendar come from German inflation reads, BOE consumer credit and mortgage approvals, Eurozone sentiment and confidence reads, US ADP employment, GDP, and pending homes sales.AUDUSD – technical overview
There are signs of the potential formation of a longer-term base following the late 2022 surge back above 0.6500. Next key resistance comes in at 0.7284. Setbacks should continue to be well supported ahead of 0.6300. Only a monthly close below 0.6400 would give reason for rethink.AUDUSD – fundamental overview
The Australian Dollar has received a nice boost into Wednesday on the back of hawkish RBA Bullock comments. RBA Bullock said the central bank may have to hike again to combat high inflation, while stressing all central banks are now grappling with the complex issue of how much further to raise rates. Key standouts on Wednesday’s calendar come from German inflation reads, BOE consumer credit and mortgage approvals, Eurozone sentiment and confidence reads, US ADP employment, GDP, and pending homes sales.USDCAD – technical overview
Above 1.3000 signals an end to a period of longer-term bearish consolidation and suggests the market is in the process of carving out a more significant longer-term base. Next key resistance now comes in up into the 1.4000 area. Setbacks should be very well supported down into the 1.3000 area.USDCAD – fundamental overview
Better bid commodities, including solid demand for oil, along with renewed risk appetite in global markets have helped to open a recovery in the Canadian Dollar. Key standouts on Wednesday’s calendar come from German inflation reads, BOE consumer credit and mortgage approvals, Eurozone sentiment and confidence reads, US ADP employment, GDP, and pending homes sales.NZDUSD – technical overview
Overall pressure remains on the downside with the market once again stalling out on a run up into the 0.6500 area. Ultimately, a break back above 0.6577 would be required to take the immediate pressure off the downside. A monthly close below 0.6000 would intensify bearish price action.NZDUSD – fundamental overview
The New Zealand Dollar is doing its best to recover from yearly lows on the back of broad US Dollar selling, risk on flow and commodities prices demand. An IMF report highlighting upward pressure on wages has also inspired additional demand for the Kiwi rate. Key standouts on Wednesday’s calendar come from German inflation reads, BOE consumer credit and mortgage approvals, Eurozone sentiment and confidence reads, US ADP employment, GDP, and pending homes sales.US SPX 500 – technical overview
Longer-term technical studies are in the process of unwinding from extended readings off record highs. Look for rallies to be well capped in favor of lower tops and lower lows. A monthly close back above 4600 will be required to take the immediate pressure off the downside. Next key support comes in at 4328.US SPX 500 – fundamental overview
We've finally reached a point in the cycle where the Fed recognizes unanchored inflation expectations pose a greater downside risk than over-tightening. This is significant, as it means less investor friendly monetary policy. Overall, we expect inflation to continue to be a problem in 2023 that results in downside pressure into rallies despite market expectations that would argue otherwise.GOLD (SPOT) – technical overview
The 2019 breakout above the 2016 high at 1375 was a significant development, opening the door for fresh record highs. Setbacks should now be well supported above 1600 on a monthly close basis ahead of the next major upside extension. Next major resistance comes in at 2100, above which opens the next extension towards 2500.GOLD (SPOT) – fundamental overview
The yellow metal continues to be well supported on dips with solid demand from medium and longer-term accounts. These players are more concerned about inflation risk and a less upbeat global growth outlook. All of this should keep the commodity well supported, with many market participants also fleeing to the hard asset as the grand dichotomy of record high equities and record low yields comes to an unnerving climax.