


Next 24 hours: Profit taking kicks in ahead major CB decisions
Today’s report: Price action all about central bank event risk positioning
Things have been mostly quiet as the new week gets going. What we have seen has been mild selling of the US Dollar and consolidation in US equities. A lot of this can be attributed to market positioning into a heavier calendar from tomorrow through the remainder of the week.
Wake-up call
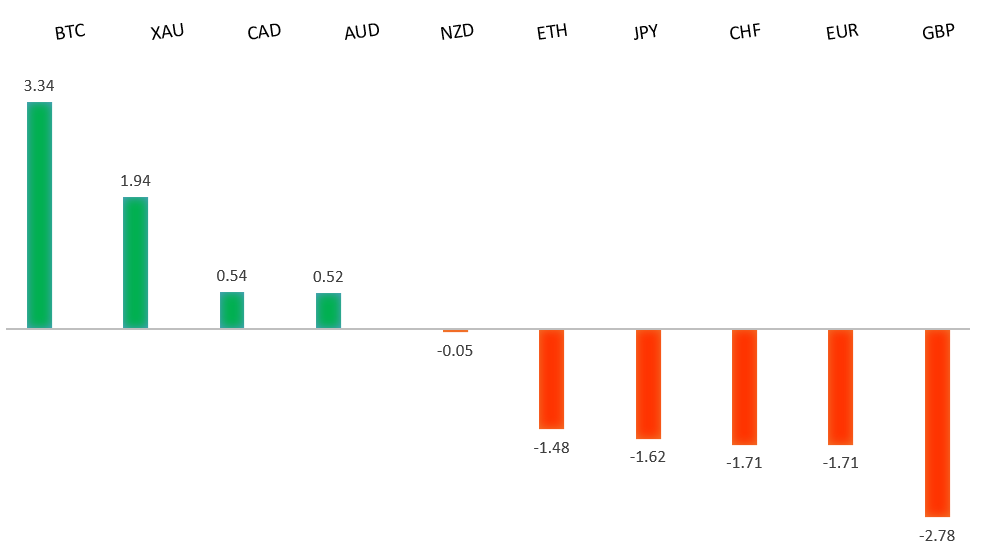
Peformance chart: 30 Day Performance vs. US dollar (%)
Suggested reading
- Dalio’s Shakespearean Turn Is a Sign of the Times, A. Brown, Bloomberg (September 18, 2023)
- Why the UK has a Problem with Maths, M. Green, Financial Times (September 19, 2023)
Chart talk: Technical & fundamental highlights
Choose pair:
EURUSD – technical overview
The Euro remains well supported on dips following a run to the topside through 1.1000. Any additional setbacks should be well supported ahead of 1.0500 in favor of a bullish continuation. Ultimately, only a monthly close back below 1.0500 would give reason for concern. Next key resistance comes in the form of the 2023 high at 1.1276.EURUSD – fundamental overview
A lot of the ECB talk post last week's dovish rate hike has come out sounding a lot more hawkish than what we got in the official central bank communication. This includes comments from ECB's Kazaks, Mueller, Vasle, and Holzmann. The Euro has managed to recover as a consequence. Key standouts on Tuesday’s calendar come from the Eurozone current account, Eurozone inflation, Canada inflation, an ECB Elderson speech, US housing starts, and US building permits.EURUSD - Technical charts in detail
GBPUSD – technical overview
Signs have emerged of the market wanting to put in a longer-term base after collapsing to a record low in September 2022. The November 2022 monthly close back above 1.2000 strengthens this prospect. Any setbacks should now be well supported ahead of 1.2000. Next key resistance comes in at 1.3143.GBPUSD – fundamental overview
Last week's dreadful UK housing data has forced a repricing of BOE expectations, with many traders now pricing in a dovish hike from the central bank later this week. Odds for a hike trade around 80%. Key standouts on Tuesday’s calendar come from the Eurozone current account, Eurozone inflation, Canada inflation, an ECB Elderson speech, US housing starts, and US building permits.USDJPY – technical overview
At this stage, it looks like the market is wanting to resume the bigger picture uptrend and head back towards a retest of that multi-year high from October 2022 up at 151.95. Look for any weakness to continue to be well supported on dips.USDJPY – fundamental overview
Japan markets get back to fuller form following a Monday holiday. The Yen has managed to hold steady as JGB yields stay pinned to recent highs. The market is also positioning ahead of this Friday's anticipated BOJ decision. Key standouts on Tuesday’s calendar come from the Eurozone current account, Eurozone inflation, Canada inflation, an ECB Elderson speech, US housing starts, and US building permits.AUDUSD – technical overview
There are signs of the potential formation of a longer-term base with the market trading down into a meaningful longer-term support zone. Only a monthly close below 0.6400 would give reason for rethink. Back above 0.6523 will take the immediate pressure off the downside and strengthen case for a bottom.AUDUSD – fundamental overview
China banking and property shares have leaked lower despite recent stimulus measures. Meanwhile copper and miners (XME) were also under pressure to start the week, all of which has been limiting upside for the Australian Dollar. The market will now digest the latest RBA Minutes release. Otherwise, key standouts on Tuesday’s calendar come from the Eurozone current account, Eurozone inflation, Canada inflation, an ECB Elderson speech, US housing starts, and US building permits.USDCAD – technical overview
Above 1.3000 signals an end to a period of longer-term bearish consolidation and suggests the market is in the process of carving out a more significant longer-term base. Next key resistance now comes in up into the 1.4000 area. Setbacks should be very well supported down into the 1.3000 area.USDCAD – fundamental overview
The Canadian Dollar is off to a good start this week, getting a boost from higher oil and gold, along with solid Canada data in the form of industrial product and raw materials prices. Key standouts on Tuesday’s calendar come from the Eurozone current account, Eurozone inflation, Canada inflation, an ECB Elderson speech, US housing starts, and US building permits.NZDUSD – technical overview
Overall pressure remains on the downside with the market once again stalling out on a run up into the 0.6500 area. Ultimately, a break back above 0.6015 would be required to take the immediate pressure off the downside. A monthly close below 0.6000 would intensify bearish price action.NZDUSD – fundamental overview
NZIER sees average 2023-2024 GDP slowing to 0.4% from 2.9% in 2022-2023. This has kept the New Zealand Dollar from wanting to run much higher. Key standouts on Tuesday’s calendar come from the Eurozone current account, Eurozone inflation, Canada inflation, an ECB Elderson speech, US housing starts, and US building permits.US SPX 500 – technical overview
Longer-term technical studies are in the process of unwinding from extended readings off record highs. Look for rallies to be well capped in favor of lower tops and lower lows. A monthly close back above 4600 will be required to take the immediate pressure off the downside. Next key support comes in at 4328.US SPX 500 – fundamental overview
We've finally reached a point in the cycle where the Fed recognizes unanchored inflation expectations pose a greater downside risk than over-tightening. This is significant, as it means less investor friendly monetary policy, even in the face of a less certain growth outlook. Overall, we expect inflation to continue to be a problem in 2023 that results in downside pressure into rallies despite market expectations that would argue otherwise.GOLD (SPOT) – technical overview
The 2019 breakout above the 2016 high at 1375 was a significant development, opening the door for fresh record highs. Setbacks should now be well supported above 1600 on a monthly close basis ahead of the next major upside extension. Next major resistance comes in at 2100, above which opens the next extension towards 2500.GOLD (SPOT) – fundamental overview
The yellow metal continues to be well supported on dips with solid demand from medium and longer-term accounts. These players are more concerned about inflation risk and a less upbeat global growth outlook. All of this should keep the commodity well supported, with many market participants also fleeing to the hard asset as the grand dichotomy of record high equities and record low yields comes to an unnerving climax.