


Special report: FOMC Decision Preview
Today’s report: Waiting for more clarity
Activity has slowed down quite a bit into today, with the market not wanting to make any fresh decisions with respect to direction until getting more clarity from the Fed.
Wake-up call
- Eurozone inflation
- inflation data
- Yield differentials
- RBA Minutes
- hike odds
- Fed decision
- Messy combo
- Dealers report
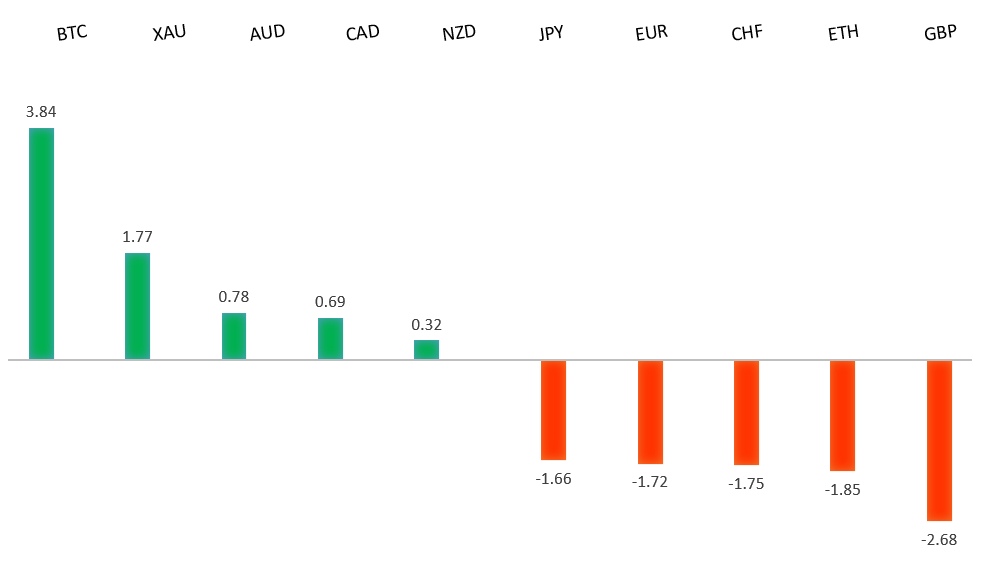
Peformance chart: 30 Day Performance vs. US dollar (%)
Suggested reading
- A 36-Hour, 11-Nation Marathon Won’t Settle Rates for the Year, J. Authers, Bloomberg (September 19, 2023)
- Cognitive Dollar Dissonance: Double-Edged Sword, Fisher Investments (September 18, 2023)
Chart talk: Technical & fundamental highlights
Choose pair:
EURUSD – technical overview
The Euro remains well supported on dips following a run to the topside through 1.1000. Any additional setbacks should be well supported ahead of 1.0500 in favor of a bullish continuation. Ultimately, only a monthly close back below 1.0500 would give reason for concern. Next key resistance comes in the form of the 2023 high at 1.1276.EURUSD – fundamental overview
The Euro has stalled out after a two day rebound as Eurozone inflation data is revised slightly lower. Key standouts on today’s calendar come from German producer prices, UK inflation, a batch of ECB speak, the Bank of Canada Summary of Deliberations, and the Fed decision late in the day.EURUSD - Technical charts in detail
GBPUSD – technical overview
Signs have emerged of the market wanting to put in a longer-term base after collapsing to a record low in September 2022. The November 2022 monthly close back above 1.2000 strengthens this prospect. Any setbacks should now be well supported ahead of 1.2000. Next key resistance comes in at 1.3143.GBPUSD – fundamental overview
Last week's dreadful UK housing data has forced a repricing of BOE expectations, with many traders now pricing in a dovish hike from the central bank tomorrow. Odds for a hike trade around 80%. Today's UK inflation data will likely add more fuel to the fire. Key standouts on today’s calendar come from German producer prices, UK inflation, a batch of ECB speak, the Bank of Canada Summary of Deliberations, and the Fed decision late in the day.USDJPY – technical overview
At this stage, it looks like the market is wanting to resume the bigger picture uptrend and head back towards a retest of that multi-year high from October 2022 up at 151.95. Look for any weakness to continue to be well supported on dips.USDJPY – fundamental overview
The Bank of Japan is not expected to make any policy changes when it meets on Friday and yield differentials continue to move in the Buck's favor. Key standouts on today’s calendar come from German producer prices, UK inflation, a batch of ECB speak, the Bank of Canada Summary of Deliberations, and the Fed decision late in the day.AUDUSD – technical overview
There are signs of the potential formation of a longer-term base with the market trading down into a meaningful longer-term support zone. Only a monthly close below 0.6400 would give reason for rethink. Back above 0.6523 will take the immediate pressure off the downside and strengthen case for a bottom.AUDUSD – fundamental overview
The fact that the RBA left the door open for additional rate hikes has somewhat supported the Australian Dollar. At the same time, rallies have been well capped with the central bank also saying the hurdle for raising rates was high. Meanwhile broad based risk off flow is of no help to the Australian Dollar either. Key standouts on today’s calendar come from German producer prices, UK inflation, a batch of ECB speak, the Bank of Canada Summary of Deliberations, and the Fed decision late in the day.USDCAD – technical overview
Above 1.3000 signals an end to a period of longer-term bearish consolidation and suggests the market is in the process of carving out a more significant longer-term base. Next key resistance now comes in up into the 1.4000 area. Setbacks should be very well supported down into the 1.3000 area.USDCAD – fundamental overview
The Canadian Dollar wasn't bothered by the fact that oil and gold were lower on Tuesday. All that mattered was the hotter than expected Canada inflation data which resulted in heavy Canadian Dollar demand. Odds for a Bank of Canada hike at the next meeting have now doubled to around 50%. Key standouts on today’s calendar come from German producer prices, UK inflation, a batch of ECB speak, the Bank of Canada Summary of Deliberations, and the Fed decision late in the day.NZDUSD – technical overview
Overall pressure remains on the downside with the market once again stalling out on a run up into the 0.6500 area. Ultimately, a break back above 0.6015 would be required to take the immediate pressure off the downside. A monthly close below 0.6000 would intensify bearish price action.NZDUSD – fundamental overview
No major updates out of New Zealand and most of the price action ahead will hinge on US Dollar sentiment in the aftermath of today's FOMC risk. Key standouts on today’s calendar come from German producer prices, UK inflation, a batch of ECB speak, the Bank of Canada Summary of Deliberations, and the Fed decision late in the day.US SPX 500 – technical overview
Longer-term technical studies are in the process of unwinding from extended readings off record highs. Look for rallies to be well capped in favor of lower tops and lower lows. A monthly close back above 4600 will be required to take the immediate pressure off the downside. Next key support comes in at 4328.US SPX 500 – fundamental overview
We've finally reached a point in the cycle where the Fed recognizes unanchored inflation expectations pose a greater downside risk than over-tightening. This is significant, as it means less investor friendly monetary policy, even in the face of a less certain growth outlook. Overall, we expect inflation to continue to be a problem in 2023 that results in downside pressure into rallies despite market expectations that would argue otherwise.GOLD (SPOT) – technical overview
The 2019 breakout above the 2016 high at 1375 was a significant development, opening the door for fresh record highs. Setbacks should now be well supported above 1600 on a monthly close basis ahead of the next major upside extension. Next major resistance comes in at 2100, above which opens the next extension towards 2500.GOLD (SPOT) – fundamental overview
The yellow metal continues to be well supported on dips with solid demand from medium and longer-term accounts. These players are more concerned about inflation risk and a less upbeat global growth outlook. All of this should keep the commodity well supported, with many market participants also fleeing to the hard asset as the grand dichotomy of record high equities and record low yields comes to an unnerving climax.