


Next 24 hours: Monetary policy divergence becoming a bigger deal
Today’s report: Fed refuses to bend to the will of the market
No surprise to see the market reaction in the aftermath of Wednesday’s Fed decision. We had warned the balance of risk was tilted this way in our special report and indeed this is how things have played out.
Wake-up call
- hawkish Makhlouf
- soft inflation
- Kanda comments
- leading index
- Oil slide
- sentiment sours
- Policy outlook
- Dealers report
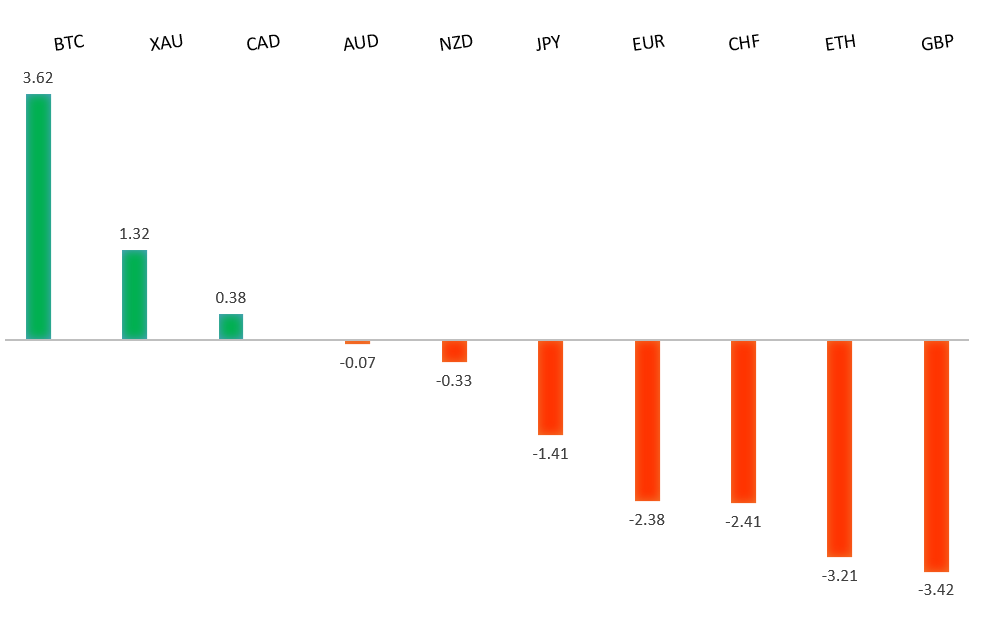
Peformance chart: 30 Day Performance vs. US dollar (%)
Suggested reading
- Read the Fine Print on Bonds’ Sale of the Century, J. Authers, Bloomberg (September 20, 2023)
- Biodiversity Funds Are Springing Up in the Investor Market, A. Ross, FT (September 21, 2023)
Chart talk: Technical & fundamental highlights
Choose pair:
EURUSD – technical overview
The Euro remains well supported on dips following a run to the topside through 1.1000. Any additional setbacks should be well supported ahead of 1.0500 in favor of a bullish continuation. Ultimately, only a monthly close back below 1.0500 would give reason for concern. Next key resistance comes in the form of the 2023 high at 1.1276.EURUSD – fundamental overview
The Euro extended its run of declines after initially trying to trade higher on hawkish ECB Makhlouf comments. The hawkish, higher for longer Fed communication was what forced things to reverse course. The local market is now pricing the ECB rate holding through Q1 2024. Key standouts on Thursday’s calendar come from the BOE decision, Canada housing data, and US reads in the form of initial jobless claims, the Philly Fed, and existing home sales.EURUSD - Technical charts in detail
GBPUSD – technical overview
Signs have emerged of the market wanting to put in a longer-term base after collapsing to a record low in September 2022. The November 2022 monthly close back above 1.2000 strengthens this prospect. Any setbacks should now be well supported ahead of 1.2000. Next key resistance comes in at 1.3143.GBPUSD – fundamental overview
The Pound took a big hit on Wednesday after taking in softer UK inflation data and then contending with a more hawkish leaning Fed communication. Odds for a BOE rate hike later today are now a coin toss from around 80% on Tuesday. Key standouts on Thursday’s calendar come from the BOE decision, Canada housing data, and US reads in the form of initial jobless claims, the Philly Fed, and existing home sales.USDJPY – technical overview
At this stage, it looks like the market is wanting to resume the bigger picture uptrend and head back towards a retest of that multi-year high from October 2022 up at 151.95. Look for any weakness to continue to be well supported on dips.USDJPY – fundamental overview
The Yen has extended a fresh run of yearly declines as yield differentials continue to move in the Buck's favor after the Fed put out another hawkish communication. Comments from Masato Kanda have done little to temper Yen declines after the official issued a veiled intervention threat that Japan was in close contact with US counterparts relating to the Yen weakness. Key standouts on Thursday’s calendar come from the BOE decision, Canada housing data, and US reads in the form of initial jobless claims, the Philly Fed, and existing home sales.AUDUSD – technical overview
There are signs of the potential formation of a longer-term base with the market trading down into a meaningful longer-term support zone. Only a monthly close below 0.6400 would give reason for rethink. Back above 0.6523 will take the immediate pressure off the downside and strengthen case for a bottom.AUDUSD – fundamental overview
The Australian Dollar is right back under pressure into Thursday after taking hits from a decline in the Westpac leading index, a more hawkish leaning Fed communication, and lower US equities. Key standouts on Thursday’s calendar come from the BOE decision, Canada housing data, and US reads in the form of initial jobless claims, the Philly Fed, and existing home sales.USDCAD – technical overview
Above 1.3000 signals an end to a period of longer-term bearish consolidation and suggests the market is in the process of carving out a more significant longer-term base. Next key resistance now comes in up into the 1.4000 area. Setbacks should be very well supported down into the 1.3000 area.USDCAD – fundamental overview
The Canadian Dollar hasn't been able to ignore the slide in the price of oil and lower US equities in the aftermath of a more hawkish leaning Fed communication. The move comes after we had seen decent Canadian Dollar gains following hotter than expected Canada inflation data earlier in the week. Key standouts on Thursday’s calendar come from the BOE decision, Canada housing data, and US reads in the form of initial jobless claims, the Philly Fed, and existing home sales.NZDUSD – technical overview
Overall pressure remains on the downside with the market once again stalling out on a run up into the 0.6500 area. Ultimately, a break back above 0.6015 would be required to take the immediate pressure off the downside. A monthly close below 0.6000 would intensify bearish price action.NZDUSD – fundamental overview
No major updates out of New Zealand and most of the price action has been around renewed broad based US Dollar demand and downside pressure on stocks in the aftermath of a more hawkish leaning Fed communication. Key standouts on Thursday’s calendar come from the BOE decision, Canada housing data, and US reads in the form of initial jobless claims, the Philly Fed, and existing home sales.US SPX 500 – technical overview
Longer-term technical studies are in the process of unwinding from extended readings off record highs. Look for rallies to be well capped in favor of lower tops and lower lows. A monthly close back above 4600 will be required to take the immediate pressure off the downside. Next key support comes in at 4328.US SPX 500 – fundamental overview
We've finally reached a point in the cycle where the Fed recognizes unanchored inflation expectations pose a greater downside risk than over-tightening. This is significant, as it means less investor friendly monetary policy, especially with the growth outlook looking up in recent months. Overall, we expect inflation to continue to be a problem in 2023 that results in downside pressure into rallies despite market expectations that would argue otherwise.GOLD (SPOT) – technical overview
The 2019 breakout above the 2016 high at 1375 was a significant development, opening the door for fresh record highs. Setbacks should now be well supported above 1600 on a monthly close basis ahead of the next major upside extension. Next major resistance comes in at 2100, above which opens the next extension towards 2500.GOLD (SPOT) – fundamental overview
The yellow metal continues to be well supported on dips with solid demand from medium and longer-term accounts. These players are more concerned about inflation risk and a less upbeat global growth outlook. All of this should keep the commodity well supported, with many market participants also fleeing to the hard asset as the grand dichotomy of record high equities and record low yields comes to an unnerving climax.