


Next 24 hours: Investors less bullish as Buck continues to run
Today’s report: Can't escape the doom and gloom
Investors are becoming increasingly uncomfortable with the prospect of higher for longer policy in the US at a time where there continues to be legitimate concerns about the health of the economy. All of this also comes at a time where monetary policy divergence between the Fed and other major central banks has become more pronounced.
Wake-up call
- peak rates
- think tank
- BOJ Minutes
- Slumping China
- Higher oil
- stronger data
- Policy outlook
- Dealers report
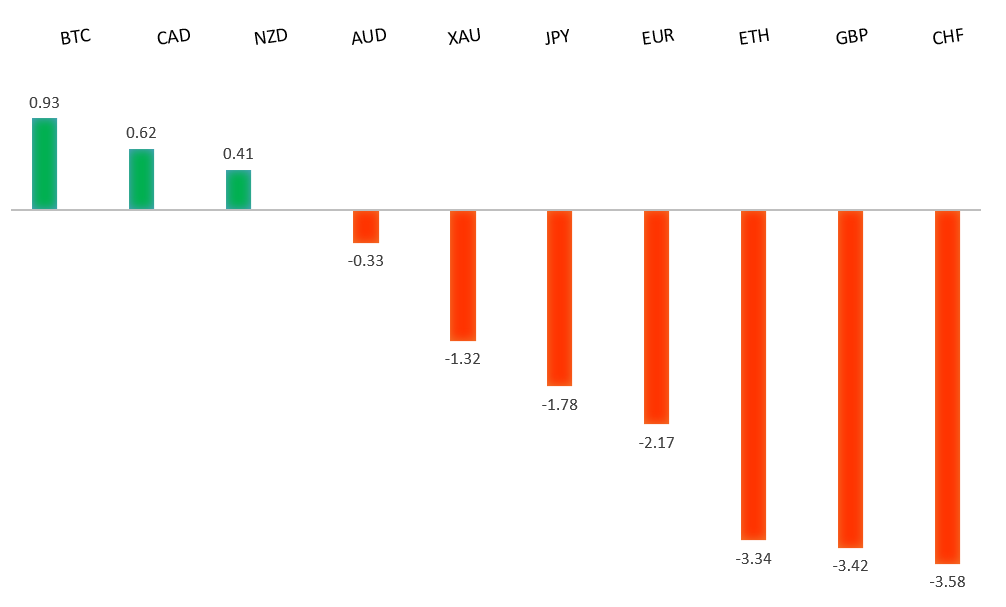
Peformance chart: 30 Day Performance vs. US dollar (%)
Suggested reading
- American Exceptionalism Resides in AI, Not Pink Houses, J. Authers, Bloomberg (September 27, 2023)
- A Glide Path to Fed Nirvana That Really Makes Me Wonder, J. Calhoun, Alhambra (September 24, 2023)
Chart talk: Technical & fundamental highlights
Choose pair:
EURUSD – technical overview
The Euro remains well supported on dips following a run to the topside through 1.1000. Any additional setbacks should be well supported ahead of 1.0500 in favor of a bullish continuation. Ultimately, only a monthly close back below 1.0500 would give reason for concern. Next key resistance comes in the form of the 2023 high at 1.1276.EURUSD – fundamental overview
The Euro can't catch a bid right now, with the single currency extending declines against the Buck on the back of more dovish ECB speak and a market that sees no more rate hikes, embracing peak rates at 4%. Key standouts on Wednesday’s calendar come from German consumer confidence reads, Eurozone money supply, and US durable goods.EURUSD - Technical charts in detail
GBPUSD – technical overview
Signs have emerged of the market wanting to put in a longer-term base after collapsing to a record low in September 2022. The November 2022 monthly close back above 1.2000 strengthens this prospect. Any setbacks should now be well supported ahead of 1.2000. Next key resistance comes in at 1.3143.GBPUSD – fundamental overview
The outlook in the UK continues to darken, which has opened more downside pressure on the Pound. Former BOE member Posen has most recently issued a think tank report showing negative GDP for 2023 and 2024. Key standouts on Wednesday’s calendar come from German consumer confidence reads, Eurozone money supply, and US durable goods.USDJPY – technical overview
At this stage, it looks like the market is wanting to resume the bigger picture uptrend and head back towards a retest of that multi-year high from October 2022 up at 151.95. Look for any weakness to continue to be well supported on dips.USDJPY – fundamental overview
The Yen remains under pressure at fresh yearly lows against the Buck in the aftermath of last Friday's dovish BOJ decision. Adding insult to injury, the Japanese government has turned to even more fiscal spending to ease inflation pain. The Yen hasn't gotten any help from the BOJ Minutes which revealed one member saying it might be possible to discern that the bank's long-sought inflation target has been achieved during Q1 2024. Overall, the Minutes were dovish. Key standouts on Wednesday’s calendar come from German consumer confidence reads, Eurozone money supply, and US durable goods.AUDUSD – technical overview
There are signs of the potential formation of a longer-term base with the market trading down into a meaningful longer-term support zone. Only a monthly close below 0.6400 would give reason for rethink. Back above 0.6523 will take the immediate pressure off the downside and strengthen case for a bottom.AUDUSD – fundamental overview
The Australian Dollar remains under pressure on the back of the hurting China markets and downbeat global sentiment. Key standouts on Wednesday’s calendar come from German consumer confidence reads, Eurozone money supply, and US durable goods.USDCAD – technical overview
Above 1.3000 signals an end to a period of longer-term bearish consolidation and suggests the market is in the process of carving out a more significant longer-term base. Next key resistance now comes in up into the 1.4000 area. Setbacks should be very well supported down into the 1.3000 area.USDCAD – fundamental overview
The Canadian Dollar hasn't been able to escape fallout in global markets, with the intense downturn in risk sentiment weighing on the Loonie despite higher oil prices and a more hawkish Bank of Canada outlook. Key standouts on Wednesday’s calendar come from German consumer confidence reads, Eurozone money supply, and US durable goods.NZDUSD – technical overview
Overall pressure remains on the downside with the market once again stalling out on a run up into the 0.6500 area. Ultimately, a break back above 0.6015 would be required to take the immediate pressure off the downside. A monthly close below 0.6000 would intensify bearish price action.NZDUSD – fundamental overview
Though the New Zealand Dollar remains weighed down on broad based US Dollar demand and risk off flow, the currency has held up better than its commodity currency cousins in recent sessions, perhaps on sustained momentum from last week's better than expected Thursday Kiwi GDP report. Key standouts on Wednesday’s calendar come from German consumer confidence reads, Eurozone money supply, and US durable goods.US SPX 500 – technical overview
Longer-term technical studies are in the process of unwinding from extended readings off record highs. Look for rallies to be well capped in favor of lower tops and lower lows. A monthly close back above 4600 will be required to take the immediate pressure off the downside. Next key support comes in at 4257.US SPX 500 – fundamental overview
We've finally reached a point in the cycle where the Fed recognizes unanchored inflation expectations pose a greater downside risk than over-tightening. This is significant, as it means less investor friendly monetary policy, especially with the growth outlook looking up in recent months. Overall, we expect inflation to continue to be a problem in 2023 that results in downside pressure into rallies despite market expectations that would argue otherwise.GOLD (SPOT) – technical overview
The 2019 breakout above the 2016 high at 1375 was a significant development, opening the door for fresh record highs. Setbacks should now be well supported above 1600 on a monthly close basis ahead of the next major upside extension. Next major resistance comes in at 2100, above which opens the next extension towards 2500.GOLD (SPOT) – fundamental overview
The yellow metal continues to be well supported on dips with solid demand from medium and longer-term accounts. These players are more concerned about inflation risk and a less upbeat global growth outlook. All of this should keep the commodity well supported, with many market participants also fleeing to the hard asset as the grand dichotomy of record high equities and record low yields comes to an unnerving climax.