


Next 24 hours: Investors looking for reversal day
Today’s report: Long-term US yields to 16 year high
Risk markets haven’t been able to get any relief as signs continue to point to a slower global economy going up against a relatively solid US economy, which means significant monetary policy divergence and a less investor friendly higher for longer Fed outlook.
Wake-up call
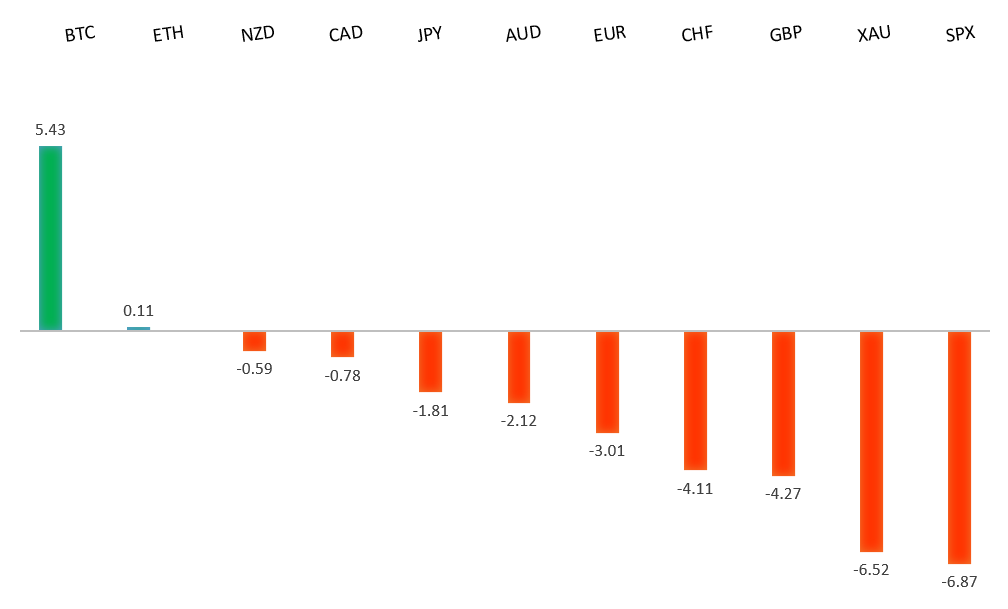
Peformance chart: 30 Day Performance vs. US dollar (%)
Suggested reading
- No Such Thing as a Cautious Portfolio Anymore, M. Somerset Webb, Bloomberg (October 4, 2023)
- Nuclear Renaissance in Europe?, T. Wilson, Financial Times (October 2, 2023)
Chart talk: Technical & fundamental highlights
Choose pair:
EURUSD – technical overview
Any additional setbacks should be well supported on dips below 1.0500 in favor of the start to the next major upside extension. Ultimately, only a monthly close back below 1.0500 would give reason for concern. Back above 1.0618 will take the immediate pressure off the downside.EURUSD – fundamental overview
All of this latest downside in the Euro to fresh yearly lows has come from the US Dollar side of the equation, after Tuesday's economic calendar was empty in the Eurozone. Key standouts on Wednesday’s calendar come from German, Eurozone, and UK PMI reads, Eurozone retail sales, an ECB Lagarde speech, Eurozone producer prices, US ADP employment, US services PMIs, and US factory orders.EURUSD - Technical charts in detail
GBPUSD – technical overview
Signs have emerged of the market wanting to put in a longer-term base after collapsing to a record low in September 2022. The November 2022 monthly close back above 1.2000 strengthens this prospect. Any setbacks should now be well supported ahead of 1.2000. Next key resistance comes in at 1.3143.GBPUSD – fundamental overview
All of this latest downside in the Pound has come from the US Dollar side of the equation, after Tuesday's economic calendar was empty in the UK. Key standouts on Wednesday’s calendar come from German, Eurozone, and UK PMI reads, Eurozone retail sales, an ECB Lagarde speech, Eurozone producer prices, US ADP employment, US services PMIs, and US factory orders.USDJPY – technical overview
At this stage, it looks like the market is wanting to resume the bigger picture uptrend and head back towards a retest of that multi-year high from October 2022 up at 151.95. Look for any weakness to continue to be well supported on dips.USDJPY – fundamental overview
Japan's MOF haven't confirmed any involvement, though the Street presumes Tuesday's sharp round of buying of the Yen had some official push behind it after USDJPY breached the 150 barrier. Key standouts on Wednesday’s calendar come from German, Eurozone, and UK PMI reads, Eurozone retail sales, an ECB Lagarde speech, Eurozone producer prices, US ADP employment, US services PMIs, and US factory orders.AUDUSD – technical overview
There are signs of the potential formation of a longer-term base with the market trading down into a meaningful longer-term support zone. Only a monthly close below 0.6300 would give reason for rethink. Back above 0.6523 will take the immediate pressure off the downside and strengthen case for a bottom.AUDUSD – fundamental overview
The Australian Dollar was slammed to a fresh yearly low on Tuesday, despite the RBA maintaining a tightening bias and despite Aussie building approvals coming in well above forecast. Risk off flow and broad US Dollar demand have been far too influential in price action. Key standouts on Wednesday’s calendar come from German, Eurozone, and UK PMI reads, Eurozone retail sales, an ECB Lagarde speech, Eurozone producer prices, US ADP employment, US services PMIs, and US factory orders.USDCAD – technical overview
Above 1.3000 signals an end to a period of longer-term bearish consolidation and suggests the market is in the process of carving out a more significant longer-term base. Next key resistance now comes in up into the 1.4000 area. Setbacks should be very well supported down into the 1.3000 area.USDCAD – fundamental overview
The Canadian Dollar has sunk to its lowest levels since all of the bank turmoil in March, taking a hit from the downside pressure on risk assets. Key standouts on Wednesday’s calendar come from German, Eurozone, and UK PMI reads, Eurozone retail sales, an ECB Lagarde speech, Eurozone producer prices, US ADP employment, US services PMIs, and US factory orders.NZDUSD – technical overview
Overall pressure remains on the downside with the market once again stalling out on a run up into the 0.6500 area. Ultimately, a break back above 0.6049 would be required to take the immediate pressure off the downside. A monthly close below 0.5900 would intensify bearish price action.NZDUSD – fundamental overview
The New Zealand Dollar continues to hold up relatively well when considering all of the downside pressure in the other currencies against the Buck. It seems the latest improvement in New Zealand house prices has somewhat factored into price action. Key standouts on Wednesday’s calendar come from German, Eurozone, and UK PMI reads, Eurozone retail sales, an ECB Lagarde speech, Eurozone producer prices, US ADP employment, US services PMIs, and US factory orders.US SPX 500 – technical overview
Longer-term technical studies are in the process of unwinding from extended readings off record highs. Look for rallies to be well capped in favor of lower tops and lower lows. A monthly close back above 4600 will be required to take the immediate pressure off the downside. Next key support comes in at 4200.US SPX 500 – fundamental overview
We've finally reached a point in the cycle where the Fed recognizes unanchored inflation expectations pose a greater downside risk than over-tightening. This is significant, as it means less investor friendly monetary policy, especially with the growth outlook looking up in recent months. Overall, we expect inflation to continue to be a problem in 2023 that results in downside pressure into rallies despite market expectations that would argue otherwise.GOLD (SPOT) – technical overview
The 2019 breakout above the 2016 high at 1375 was a significant development, opening the door for fresh record highs. Setbacks should now be well supported above 1600 on a monthly close basis ahead of the next major upside extension. Next major resistance comes in at 2100, above which opens the next extension towards 2500.GOLD (SPOT) – fundamental overview
The yellow metal continues to be well supported on dips with solid demand from medium and longer-term accounts. These players are more concerned about inflation risk and a less upbeat global growth outlook. All of this should keep the commodity well supported, with many market participants also fleeing to the hard asset as the grand dichotomy of record high equities and record low yields comes to an unnerving climax.