


Next 24 hours: Making sense of the risk on flow
Today’s report: US market returns from holiday
Markets will get back to fuller form on this Tuesday as the US returns from the holiday session. Interestingly enough, all of the escalation in geopolitical tension has resulted in Dollar selling and higher US equity futures.
Wake-up call
- ECB Lagarde
- Metro Bank
- carry unwind
- Rallying commodities
- USDCAD Oil demand keeps Loonie propped up
- risk sentiment
- Policy outlook
- Dealers report
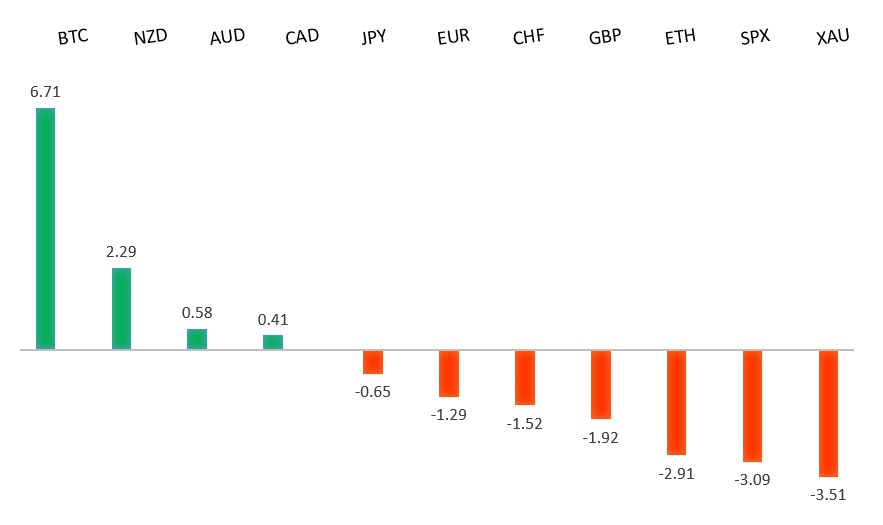
Peformance chart: 30 Day Performance vs. US dollar (%)
Suggested reading
- Please, 10-Year Treasury Notes Are Not An ‘Important’ Asset, J. Tamny, Forbes (October 8, 2023)
- Nuclear Renaissance in Europe?, T. Wilson, Financial Times (October 2, 2023)
Chart talk: Technical & fundamental highlights
Choose pair:
EURUSD – technical overview
Any additional setbacks should be well supported on dips below 1.0500 in favor of the start to the next major upside extension. Ultimately, only a monthly close back below 1.0500 would give reason for concern. Back above 1.0618 will take the immediate pressure off the downside.EURUSD – fundamental overview
The Euro was weighed down on broad risk off flow, softer Eurozone manufacturing data and a weaker headline German industrial production print. But ultimately, there were plenty of bids supporting the single currency into dips. Key standouts on Tuesday’s calendar come from an ECB Lagarde speech, US wholesale inventories, and US consumer inflation expectations. We also get more Fed speak, this time from Bostic, Waller, and Kashkari.EURUSD - Technical charts in detail
GBPUSD – technical overview
Signs have emerged of the market wanting to put in a longer-term base after collapsing to a record low in September 2022. The November 2022 monthly close back above 1.2000 strengthens this prospect. Any setbacks should now be well supported ahead of 1.2000. Next key resistance comes in at 1.3143.GBPUSD – fundamental overview
The Pound was relatively stable on Monday, but did face some selling into rallies as Metro Bank woes spilled over into smaller banks. Key standouts on Tuesday’s calendar come from an ECB Lagarde speech, US wholesale inventories, and US consumer inflation expectations. We also get more Fed speak, this time from Bostic, Waller, and Kashkari.USDJPY – technical overview
At this stage, it looks like the market is wanting to resume the bigger picture uptrend and head back towards a retest of that multi-year high from October 2022 up at 151.95. Look for any weakness to continue to be well supported on dips.USDJPY – fundamental overview
Most of the Yen demand we saw on Monday was a function of an unwinding of carry trades and flight to safety flow. Key standouts on Tuesday’s calendar come from an ECB Lagarde speech, US wholesale inventories, and US consumer inflation expectations. We also get more Fed speak, this time from Bostic, Waller, and Kashkari.AUDUSD – technical overview
There are signs of the potential formation of a longer-term base with the market trading down into a meaningful longer-term support zone. Only a monthly close below 0.6300 would give reason for rethink. Back above 0.6523 will take the immediate pressure off the downside and strengthen case for a bottom.AUDUSD – fundamental overview
The Australian Dollar has been getting a boost from rallying commodities prices and some risk on flow, presumably on expectations that rising geopolitical tensions will force the Fed into a more investor friendly policy track. Key standouts on Tuesday’s calendar come from an ECB Lagarde speech, US wholesale inventories, and US consumer inflation expectations. We also get more Fed speak, this time from Bostic, Waller, and Kashkari.USDCAD – technical overview
Above 1.3000 signals an end to a period of longer-term bearish consolidation and suggests the market is in the process of carving out a more significant longer-term base. Next key resistance now comes in up into the 1.4000 area. Setbacks should be very well supported down into the 1.3000 area.USDCAD – fundamental overview
The Canadian Dollar has performed well in recent sessions, mostly on the back of surging oil prices. We've also seen demand for currencies on expectations the latest geopolitical tension could result in a more investor friendly Fed policy adjustment. Key standouts on Tuesday’s calendar come from an ECB Lagarde speech, US wholesale inventories, and US consumer inflation expectations. We also get more Fed speak, this time from Bostic, Waller, and Kashkari.NZDUSD – technical overview
Overall pressure remains on the downside with the market once again stalling out on a run up into the 0.6500 area. Ultimately, a break back above 0.6049 would be required to take the immediate pressure off the downside. A monthly close below 0.5900 would intensify bearish price action.NZDUSD – fundamental overview
The New Zealand Dollar has been in rally mode in response to higher commodities, higher equities, and broad based selling of the US Dollar. Key standouts on Tuesday’s calendar come from an ECB Lagarde speech, US wholesale inventories, and US consumer inflation expectations. We also get more Fed speak, this time from Bostic, Waller, and Kashkari.US SPX 500 – technical overview
Longer-term technical studies are in the process of unwinding from extended readings off record highs. Look for rallies to be well capped in favor of lower tops and lower lows. A monthly close back above 4600 will be required to take the immediate pressure off the downside. Next key support comes in at 4200.US SPX 500 – fundamental overview
We've finally reached a point in the cycle where the Fed recognizes unanchored inflation expectations pose a greater downside risk than over-tightening. This is significant, as it means less investor friendly monetary policy, especially with the growth outlook looking up in recent months. Overall, we expect inflation to continue to be a problem in 2023 that results in downside pressure into rallies despite market expectations that would argue otherwise.GOLD (SPOT) – technical overview
The 2019 breakout above the 2016 high at 1375 was a significant development, opening the door for fresh record highs. Setbacks should now be well supported above 1600 on a monthly close basis ahead of the next major upside extension. Next major resistance comes in at 2100, above which opens the next extension towards 2500.GOLD (SPOT) – fundamental overview
The yellow metal continues to be well supported on dips with solid demand from medium and longer-term accounts. These players are more concerned about inflation risk and a less upbeat global growth outlook. All of this should keep the commodity well supported, with many market participants also fleeing to the hard asset as the grand dichotomy of record high equities and record low yields comes to an unnerving climax.