


Next 24 hours: Markets set to digest latest US inflation read
Today’s report: All eyes on US CPI data
It’s been interesting to see risk markets supported in recent sessions. Stocks have been trading higher this week, even in the face of escalating geopolitical tension, higher than expected US producer prices data, and a Fed Minutes that has echoed a higher for longer Fed policy communication.
Wake-up call
- ECB speak
- outlook warnings
- producer prices
- RBA Kent
- building permits
- risk sentiment
- Policy outlook
- Dealers report
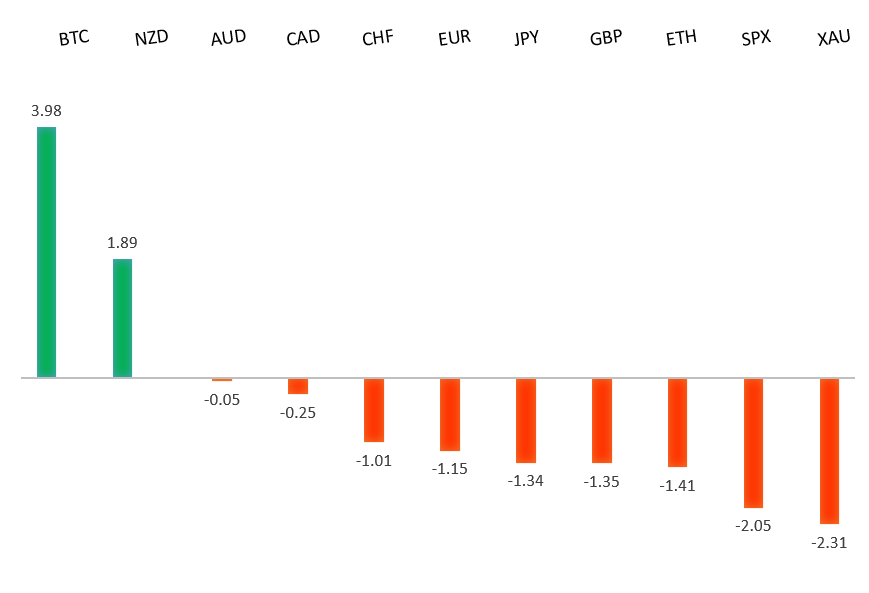
Peformance chart: 30 Day Performance vs. US dollar (%)
Suggested reading
- Inflation Appears Beaten, But Pain Over Credit Isn’t, J. Authers, FT Alphaville (October 11, 2023)
- Where SBF & Michael Lewis Went Wrong, N. Maggiulli, LOf Dollars and Data (October 10, 2023)
Chart talk: Technical & fundamental highlights
Choose pair:
EURUSD – technical overview
Any additional setbacks should be well supported on dips below 1.0500 in favor of the start to the next major upside extension. Ultimately, only a monthly close back below 1.0500 would give reason for concern. Back above 1.0618 will take the immediate pressure off the downside.EURUSD – fundamental overview
Germany has downgraded growth forecasts and ECB speak has turned more dovish. Yet, at the same time, the Euro has managed to rally of late on the back of broad based US Dollar outflows. Key standouts on Thursday’s calendar come from UK GDP and industrial production, the ECB Minutes, US CPI, and initial jobless claims.EURUSD - Technical charts in detail
GBPUSD – technical overview
Signs have emerged of the market wanting to put in a longer-term base after collapsing to a record low in September 2022. The November 2022 monthly close back above 1.2000 strengthens this prospect. Any setbacks should now be well supported ahead of 1.2000. Next key resistance comes in at 1.3143.GBPUSD – fundamental overview
The Pound continues to benefit from broad based US Dollar outflows this week. Downbeat outlooks from two UK housing-related companies has not been given much attention. Key standouts on Thursday’s calendar come from UK GDP and industrial production, the ECB Minutes, US CPI, and initial jobless claims.USDJPY – technical overview
At this stage, it looks like the market is wanting to resume the bigger picture uptrend and head back towards a retest of that multi-year high from October 2022 up at 151.95. Look for any weakness to continue to be well supported on dips.USDJPY – fundamental overview
Yield differentials continue to widen in favor of the US Dollar, with downside pressure in the Yen picking up some more after Japan producer prices came in softer than expected. Key standouts on Thursday’s calendar come from UK GDP and industrial production, the ECB Minutes, US CPI, and initial jobless claims.AUDUSD – technical overview
There are signs of the potential formation of a longer-term base with the market trading down into a meaningful longer-term support zone. Only a monthly close below 0.6300 would give reason for rethink. Back above 0.6523 will take the immediate pressure off the downside and strengthen case for a bottom.AUDUSD – fundamental overview
The copper, commodities complex has been looking more skeptical of China stimulus efforts, while RBA Kent was out endorsing a rate pause. These two developments have factored into a recent run of Aussie selling. Key standouts on Thursday’s calendar come from UK GDP and industrial production, the ECB Minutes, US CPI, and initial jobless claims.USDCAD – technical overview
Above 1.3000 signals an end to a period of longer-term bearish consolidation and suggests the market is in the process of carving out a more significant longer-term base. Next key resistance now comes in up into the 1.4000 area. Setbacks should be very well supported down into the 1.3000 area.USDCAD – fundamental overview
The Canadian Dollar has been consolidating in recent sessions, though we have seen some outperformance against its peers on the back of a good Canada building permits number. Key standouts on Thursday’s calendar come from UK GDP and industrial production, the ECB Minutes, US CPI, and initial jobless claims.NZDUSD – technical overview
Overall pressure remains on the downside with the market once again stalling out on a run up into the 0.6500 area. Ultimately, a break back above 0.6049 would be required to take the immediate pressure off the downside. A monthly close below 0.5900 would intensify bearish price action.NZDUSD – fundamental overview
The New Zealand Dollar has been better bid this week in response to higher commodities, higher equities, and broad based selling of the US Dollar. Key standouts on Thursday’s calendar come from UK GDP and industrial production, the ECB Minutes, US CPI, and initial jobless claims.US SPX 500 – technical overview
Longer-term technical studies are in the process of unwinding from extended readings off record highs. Look for rallies to be well capped in favor of lower tops and lower lows. A monthly close back above 4600 will be required to take the immediate pressure off the downside. Next key support comes in at 4200.US SPX 500 – fundamental overview
We've finally reached a point in the cycle where the Fed recognizes unanchored inflation expectations pose a greater downside risk than over-tightening. This is significant, as it means less investor friendly monetary policy, especially with the growth outlook looking up in recent months. Overall, we expect inflation to continue to be a problem in 2023 that results in downside pressure into rallies despite market expectations that would argue otherwise.GOLD (SPOT) – technical overview
The 2019 breakout above the 2016 high at 1375 was a significant development, opening the door for fresh record highs. Setbacks should now be well supported above 1600 on a monthly close basis ahead of the next major upside extension. Next major resistance comes in at 2100, above which opens the next extension towards 2500.GOLD (SPOT) – fundamental overview
The yellow metal continues to be well supported on dips with solid demand from medium and longer-term accounts. These players are more concerned about inflation risk and a less upbeat global growth outlook. All of this should keep the commodity well supported, with many market participants also fleeing to the hard asset as the grand dichotomy of record high equities and record low yields comes to an unnerving climax.