


Next 24 hours: Geopolitical stress still a thing
Today’s report: A busy day of economic data
At the moment, markets have stabilized in the aftermath of the fear and panic out of the Middle East. The fact that the situation has not escalated has led many investors to hope the situation will be contained, which has resulted in some mild risk on flow and selling of the US Dollar.
Wake-up call
- Polish election
- BOE Pill
- yield differentials
- RBA Minutes
- Inflation expectations
- inflation data
- Geopolitical risk
- Global outlook
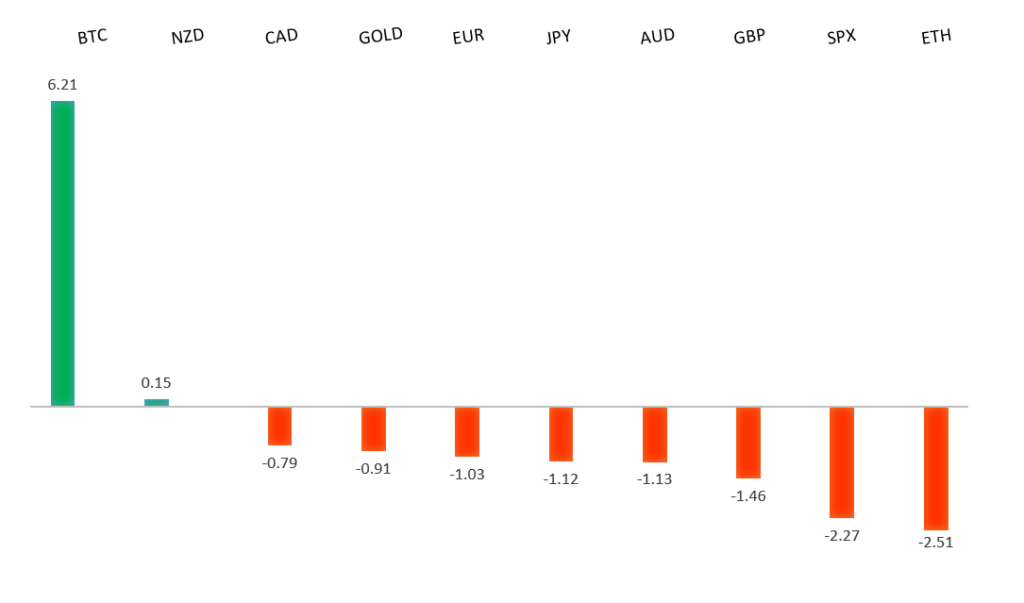
Peformance chart: 30 Day Performance vs. US dollar (%)
Suggested reading
- Is the Market Calm on the Mideast Right, or Dangerous?, J. Authers, Bloomberg (October 17, 2023)
- Javier Milei Is Under Attack for Teaching Basic Econ, T. Lowe, Examiner (October 14, 2023)
Chart talk: Technical & fundamental highlights
Choose pair:
EURUSD – technical overview
Any additional setbacks should be well supported on dips below 1.0500 in favor of the start to the next major upside extension. Ultimately, only a monthly close back below 1.0500 would give reason for concern. Back above 1.0618 will take the immediate pressure off the downside.EURUSD – fundamental overview
Most of the news out of the Eurozone of late has been more supportive of the Euro than anything else. We've just come out of a round of more hawkish speak from the likes of Lagarde, Knot, and Nagel. Polish election results have also been taken to be Euro supportive. Key standouts on Tuesday’s calendar come from UK employment, Eurozone and German ZEW reads, Canada housing starts and inflation, US retail sales, industrial production, and business inventories, and the New Zealand GDT auction.EURUSD - Technical charts in detail
GBPUSD – technical overview
Signs have emerged of the market wanting to put in a longer-term base after collapsing to a record low in September 2022. The November 2022 monthly close back above 1.2000 strengthens this prospect. Any setbacks should now be well supported ahead of 1.2000. Next key resistance comes in at 1.3143.GBPUSD – fundamental overview
BOE Pill followed up hawkish weekend comments from BOE Bailey with his own spin. Pill said sticky UK inflation may require a persistent monetary policy response, suggesting the BOE hasn't reached peak rates. Key standouts on Tuesday’s calendar come from UK employment, Eurozone and German ZEW reads, Canada housing starts and inflation, US retail sales, industrial production, and business inventories, and the New Zealand GDT auction.USDJPY – technical overview
At this stage, it looks like the market is wanting to resume the bigger picture uptrend and head back towards a retest of that multi-year high from October 2022 up at 151.95. Look for any weakness to continue to be well supported on dips.USDJPY – fundamental overview
Yield differentials continue to widen in favor of the US Dollar, with downside pressure in the Yen picking up some more after Japan inflation data came in softer than expected earlier last week and an MOF official said there was no change in the stance on FX moves. Key standouts on Tuesday’s calendar come from UK employment, Eurozone and German ZEW reads, Canada housing starts and inflation, US retail sales, industrial production, and business inventories, and the New Zealand GDT auction.AUDUSD – technical overview
There are signs of the potential formation of a longer-term base with the market trading down into a meaningful longer-term support zone. Only a monthly close below 0.6300 would give reason for rethink. Back above 0.6523 will take the immediate pressure off the downside and strengthen case for a bottom.AUDUSD – fundamental overview
The Australian Dollar got a bit of an early Tuesday boost from a hawkish read of the RBA Minutes which showed the central bank still holding a significant concern for the upside risks to inflation. Key standouts on Tuesday’s calendar come from UK employment, Eurozone and German ZEW reads, Canada housing starts and inflation, US retail sales, industrial production, and business inventories, and the New Zealand GDT auction.USDCAD – technical overview
Above 1.3000 signals an end to a period of longer-term bearish consolidation and suggests the market is in the process of carving out a more significant longer-term base. Next key resistance now comes in up into the 1.4000 area. Setbacks should be very well supported down into the 1.3000 area.USDCAD – fundamental overview
The Canadian Dollar ran higher on Monday after the Bank of Canada Q3 business outlook survey showed inflation expectations of both businesses and consumers remaining elevated despite a decline in business sentiment. Key standouts on Tuesday’s calendar come from UK employment, Eurozone and German ZEW reads, Canada housing starts and inflation, US retail sales, industrial production, and business inventories, and the New Zealand GDT auction.NZDUSD – technical overview
Overall pressure remains on the downside with the market once again stalling out on a run up into the 0.6500 area. Ultimately, a break back above 0.6049 would be required to take the immediate pressure off the downside. A monthly close below 0.5900 would intensify bearish price action.NZDUSD – fundamental overview
The New Zealand Dollar is underperforming on Tuesday after New Zealand inflation data surprised, coming in below forecast. Key standouts on Tuesday’s calendar come from UK employment, Eurozone and German ZEW reads, Canada housing starts and inflation, US retail sales, industrial production, and business inventories, and the New Zealand GDT auction.US SPX 500 – technical overview
Longer-term technical studies are in the process of unwinding from extended readings off record highs. Look for rallies to be well capped in favor of lower tops and lower lows. A monthly close back above 4600 will be required to take the immediate pressure off the downside. Next key support comes in at 4200.US SPX 500 – fundamental overview
Investors continue to struggle with the reality of a higher for longer Fed policy track in the face of ongoing worry around inflation, while also contending with an escalation in geopolitical risk. Overall, we expect inflation to continue to be a problem in 2023 that results in downside pressure into rallies despite market expectations that would argue otherwise.GOLD (SPOT) – technical overview
The 2019 breakout above the 2016 high at 1375 was a significant development, opening the door for fresh record highs. Setbacks should now be well supported above 1600 on a monthly close basis ahead of the next major upside extension. Next major resistance comes in at 2100, above which opens the next extension towards 2500.GOLD (SPOT) – fundamental overview
The yellow metal continues to be well supported on dips with solid demand from medium and longer-term accounts. These players are more concerned about inflation risk and a less stable and upbeat global growth outlook. All of this should keep the commodity well supported, with many market participants also fleeing to the hard asset as the grand dichotomy of record high equities and record low yields comes to an unnerving climax.