


Next 24 hours: Risk on flow continues; BOE leaves rates unchanged
Today’s report: Fed decision takeaways
Indeed, the Fed Chair would not rule out additional rate hikes while also dismissing calls for rate cuts. And yet, through all of that, there was still an underlying takeaway for the market that the decision leaned more to the dovish side.
Wake-up call
- EURUSD German employment data on tap
- BOE decision
- verbal intervention
- RBA pricing
- jobs report
- shrugs off
- Geopolitical risk
- Global outlook
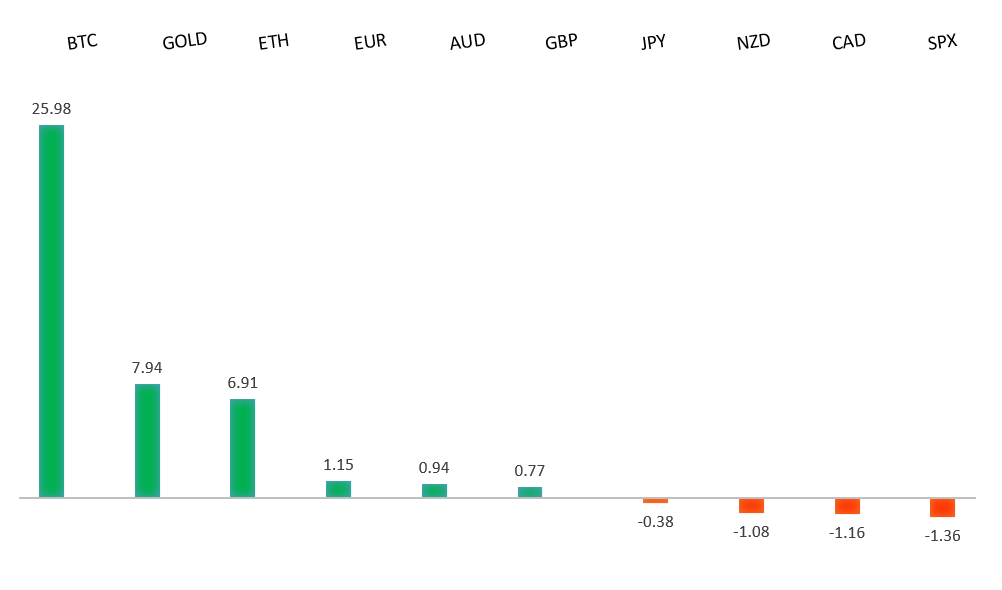
Peformance chart: 30 Day Performance vs. US dollar (%)
Suggested reading
- How To Profit From Various Loopholes In The Efficient Market, H. Tucker, Forbes (October 31, 2023)
- Can the Steel Industry Go Green?, S. Pfeifer, Financial Times (October 31, 2023)
Chart talk: Technical & fundamental highlights
Choose pair:
EURUSD – technical overview
Any additional setbacks should be well supported on dips below 1.0500 in favor of the start to the next major upside extension. Ultimately, only a monthly close back below 1.0500 would give reason for concern. Back above 1.0770 will take the immediate pressure off the downside.EURUSD – fundamental overview
Economic data out of the Eurozone hasn't been great this week, though the Euro has been getting some support in the aftermath of some softer US economic data and a market that is pricing in peak Fed rates post FOMC decision. Key standouts on Thursday’s calendar come from German employment, the BOE policy decision, US initial jobless claims, and US factory orders.EURUSD - Technical charts in detail
GBPUSD – technical overview
Signs have emerged of the market wanting to put in a longer-term base after collapsing to a record low in September 2022. The November 2022 monthly close back above 1.2000 strengthens this prospect. Any setbacks should now be well supported ahead of 1.2000. Next key resistance comes in at 1.2338.GBPUSD – fundamental overview
The Pound has been outperforming ahead of today's BOE decision on account of stronger UK housing data and broad based selling of the US Dollar. Key standouts on Thursday’s calendar come from German employment, the BOE policy decision, US initial jobless claims, and US factory orders.USDJPY – technical overview
At this stage, it looks like the market is wanting to resume the bigger picture uptrend and head back towards a retest of that multi-year high from October 2022 up at 151.95. Look for any weakness to continue to be well supported on dips.USDJPY – fundamental overview
Verbal intervention isn't entirely ineffective. Japan's Kanda was on the wires saying the Ministry of Finance was on standby, which was enough to at least inspire some mild profit taking on Yen shorts. Meanwhile, in a somewhat counterintuitive and questionable move, PM Kishida outlined a new $144 billion stimulus to offset inflation costs. Key standouts on Thursday’s calendar come from German employment, the BOE policy decision, US initial jobless claims, and US factory orders.AUDUSD – technical overview
There are signs of the potential formation of a longer-term base with the market trading down into a meaningful longer-term support zone. Only a monthly close below 0.6200 would give reason for rethink. Back above 0.6523 will take the immediate pressure off the downside and strengthen case for a bottom.AUDUSD – fundamental overview
A fresh wave of risk on flow has opened the door for a run higher in the Australian Dollar into the latter half of the week. Aussie home prices have risen to just shy of a record. Odds for an RBA rate hike next week stand at about 50%. Key standouts on Thursday’s calendar come from German employment, the BOE policy decision, US initial jobless claims, and US factory orders.USDCAD – technical overview
Above 1.3000 signals an end to a period of longer-term bearish consolidation and suggests the market is in the process of carving out a more significant longer-term base. Next key resistance now comes in up into the 1.4000 area. Setbacks should be very well supported down into the 1.3000 area.USDCAD – fundamental overview
The Canadian Dollar wasn't able to do much with a solid manufacturing PMI read, instead focusing on last week's dovish central bank decision and this week's softer GDP report. This has many a trader worrying about what might come of the Canada jobs report due tomorrow. Key standouts on Thursday’s calendar come from German employment, the BOE policy decision, US initial jobless claims, and US factory orders.NZDUSD – technical overview
Overall pressure remains on the downside with the market once again stalling out on a run up into the 0.6500 area. Ultimately, a break back above 0.6049 would be required to take the immediate pressure off the downside. A monthly close below 0.5800 will intensify bearish price action.NZDUSD – fundamental overview
New Zealand unemployment rose more than expected, to the highest level in two years, while wage growth slowed down. But in the end, none of this mattered much with risk assets in recovery mode post softer US data and a Fed decision that has the market pricing in peak rates in the US. Key standouts on Thursday’s calendar come from German employment, the BOE policy decision, US initial jobless claims, and US factory orders.US SPX 500 – technical overview
Longer-term technical studies are in the process of unwinding from extended readings off record highs. Look for rallies to be well capped in favor of lower tops and lower lows. A monthly close back above 4600 will be required to take the immediate pressure off the downside. Next key support comes in at 4200.US SPX 500 – fundamental overview
Investors continue to struggle with the reality of a higher for longer Fed policy track in the face of ongoing worry around inflation, while also contending with an escalation in geopolitical risk. Overall, we expect inflation to continue to be a problem in 2023 that results in downside pressure into rallies despite market expectations that would argue otherwise.GOLD (SPOT) – technical overview
The 2019 breakout above the 2016 high at 1375 was a significant development, opening the door for fresh record highs. Setbacks should now be well supported above 1600 on a monthly close basis ahead of the next major upside extension. Next major resistance comes in at 2100, above which opens the next extension towards 2500.GOLD (SPOT) – fundamental overview
The yellow metal continues to be well supported on dips with solid demand from medium and longer-term accounts. These players are more concerned about inflation risk and a less stable and upbeat global growth outlook. All of this should keep the commodity well supported, with many market participants also fleeing to the hard asset as the grand dichotomy of record high equities and record low yields comes to an unnerving climax.