


Today’s report: The worry around what's been behind the risk on run
As we come into the end of the week, investors are feeling a lot better than where we were when things started out. The trouble is, it hasn’t exactly been for the best of reasons.
Wake-up call
- USD selling
- BOE holds
- verbal intervention
- surplus dwindles
- Canada jobs
- election result
- Geopolitical risk
- Global outlook
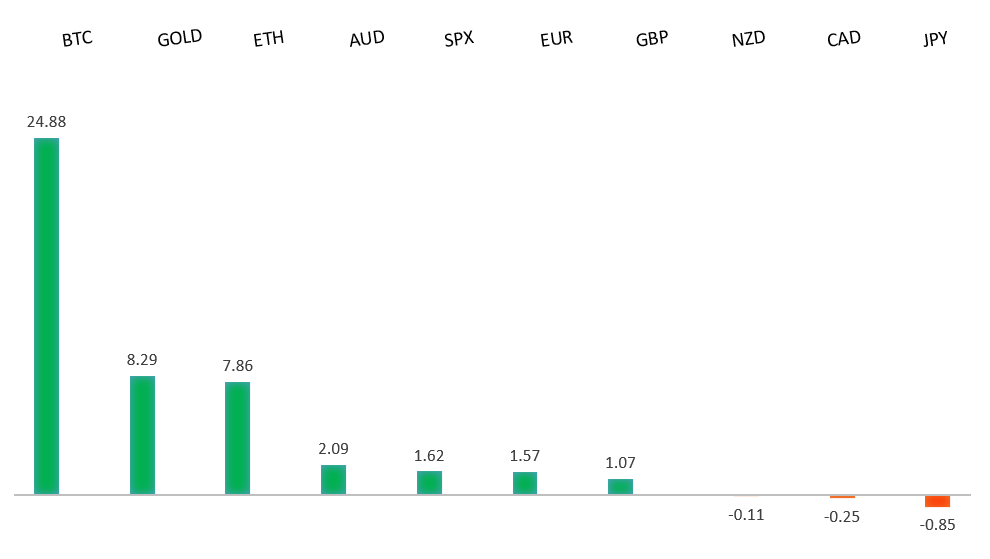
Peformance chart: 30 Day Performance vs. US dollar (%)
Suggested reading
- With the Best of Intentions, J. Wiggins, Behavioural Investment (October 31, 2023)
- Has China's Belt and Road Initiative been a success?, J. Kynge, Financial Times (October 30, 2023)
Chart talk: Technical & fundamental highlights
Choose pair:
EURUSD – technical overview
Any additional setbacks should be well supported on dips below 1.0500 in favor of the start to the next major upside extension. Ultimately, only a monthly close back below 1.0500 would give reason for concern. Back above 1.0770 will take the immediate pressure off the downside.EURUSD – fundamental overview
Economic data out of the Eurozone hasn't been great this week, though the Euro has been getting some support in the aftermath of some softer US economic data and a market that is pricing in peak Fed rates post FOMC decision. Key standouts on Friday’s calendar come from German trade, UK PMI reads, Eurozone unemployment, Canada employment, the monthly employment report out of the US, and US ISM data.EURUSD - Technical charts in detail
GBPUSD – technical overview
Signs have emerged of the market wanting to put in a longer-term base after collapsing to a record low in September 2022. The November 2022 monthly close back above 1.2000 strengthens this prospect. Any setbacks should now be well supported ahead of 1.2000. Next key resistance comes in at 1.2338.GBPUSD – fundamental overview
The BOE left rates on hold while maintaining a restrictive policy stance as widely expected. There was however some dovishness in the communication, with the 2024 UK outlook downgraded and BOE Bailey the central bank shouldn't keep restrictive policy for too long. Key standouts on Friday’s calendar come from German trade, UK PMI reads, Eurozone unemployment, Canada employment, the monthly employment report out of the US, and US ISM data.USDJPY – technical overview
At this stage, it looks like the market is wanting to resume the bigger picture uptrend and head back towards a retest of that multi-year high from October 2022 up at 151.95. Look for any weakness to continue to be well supported on dips.USDJPY – fundamental overview
Verbal intervention isn't entirely ineffective. Japan's Kanda was on the wires this saying the Ministry of Finance was on standby, which was enough to at least inspire some mild profit taking on Yen shorts. Meanwhile, in a somewhat counterintuitive and questionable move, PM Kishida outlined a new $144 billion stimulus to offset inflation costs. Broad based US Dollar selling has also factored into Yen demand. Key standouts on Friday’s calendar come from German trade, UK PMI reads, Eurozone unemployment, Canada employment, the monthly employment report out of the US, and US ISM data.AUDUSD – technical overview
There are signs of the potential formation of a longer-term base with the market trading down into a meaningful longer-term support zone. Only a monthly close below 0.6200 would give reason for rethink. Back above 0.6523 will take the immediate pressure off the downside and strengthen case for a bottom.AUDUSD – fundamental overview
Australia's trade surplus dwindled to a post-pandemic low. This was overshadowed by broad based US Dollar selling and renewed global risk appetite. Key standouts on Friday’s calendar come from German trade, UK PMI reads, Eurozone unemployment, Canada employment, the monthly employment report out of the US, and US ISM data.USDCAD – technical overview
Above 1.3000 signals an end to a period of longer-term bearish consolidation and suggests the market is in the process of carving out a more significant longer-term base. Next key resistance now comes in up into the 1.4000 area. Setbacks should be very well supported down into the 1.3000 area.USDCAD – fundamental overview
The Canadian Dollar has been getting a recovery boost from broad based US Dollar selling, risk on flow, and a recovery in the price of oil. None of this is directly Canadian economy specific, which should be a concern for the Loonie given the more dovish leaning Bank of Canada and a run of softer economic data. Key standouts on Friday’s calendar come from German trade, UK PMI reads, Eurozone unemployment, Canada employment, the monthly employment report out of the US, and US ISM data.NZDUSD – technical overview
Overall pressure remains on the downside with the market once again stalling out on a run up into the 0.6500 area. Ultimately, a break back above 0.6049 would be required to take the immediate pressure off the downside. A monthly close below 0.5800 will intensify bearish price action.NZDUSD – fundamental overview
The bid in the New Zealand Dollar today seems to have come on the back of the announcement of the final result of the New Zealand general elections, with the winning National Party now confirmed to require the support of at least two other parties to achieve a majority in Parliament. We've also seen demand on the back of broad based US Dollar selling and renewed risk on flow. Key standouts on Friday’s calendar come from German trade, UK PMI reads, Eurozone unemployment, Canada employment, the monthly employment report out of the US, and US ISM data.US SPX 500 – technical overview
Longer-term technical studies are in the process of unwinding from extended readings off record highs. Look for rallies to be well capped in favor of lower tops and lower lows. A monthly close back above 4400 will be required to take the immediate pressure off the downside. Next key support comes in at 4103.US SPX 500 – fundamental overview
Investors continue to struggle with the reality of a higher for longer Fed policy track in the face of ongoing worry around inflation, while also contending with an escalation in geopolitical risk. Overall, we expect inflation to continue to be a problem in 2023 that results in downside pressure into rallies despite market expectations that would argue otherwise.GOLD (SPOT) – technical overview
The 2019 breakout above the 2016 high at 1375 was a significant development, opening the door for fresh record highs. Setbacks should now be well supported above 1600 on a monthly close basis ahead of the next major upside extension. Next major resistance comes in at 2100, above which opens the next extension towards 2500.GOLD (SPOT) – fundamental overview
The yellow metal continues to be well supported on dips with solid demand from medium and longer-term accounts. These players are more concerned about inflation risk and a less stable and upbeat global growth outlook. All of this should keep the commodity well supported, with many market participants also fleeing to the hard asset as the grand dichotomy of record high equities and record low yields comes to an unnerving climax.