


Next 24 hours: Positioning ahead of Tuesday's US inflation data
Today’s report: The disconnect between currencies and stocks
We come into the new week contending with a disconnect in financial markets. On the one side, currency traders continue to worry about the Fed’s ongoing commitment to higher for longer policy, which has left the US Dollar in the driver’s seat.
Wake-up call
- current account
- GDP flatlines
- BOJ outlook
- metals prices
- Policy divergence
- PMI contraction
- Geopolitical risk
- Global outlook
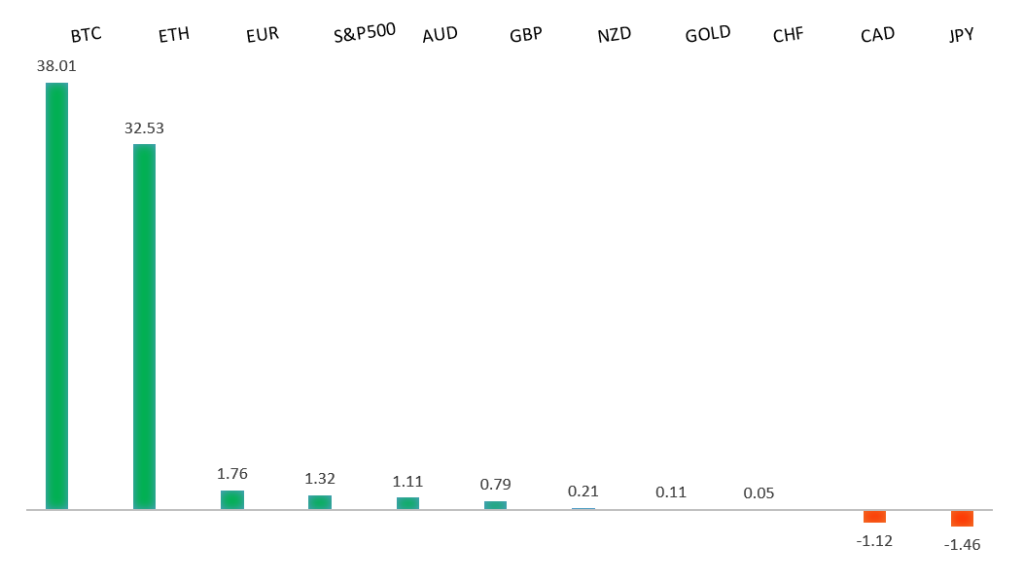
Peformance chart: 30 Day Performance vs. US dollar (%)
Suggested reading
- There’s One Fix For Inflation: It Has Nothing to Do With the Fed, J. Tamny Forbes (November 12, 2023)
- Is Ultra-Processed Food Really That Bad?, M. Speed, Financial Times (November 13, 2023)
Chart talk: Technical & fundamental highlights
Choose pair:
EURUSD – technical overview
Any additional setbacks should be well supported on dips below 1.0500 in favor of the start to the next major upside extension. Ultimately, only a monthly close back below 1.0500 would give reason for concern. Back above 1.0770 will take the immediate pressure off the downside.EURUSD – fundamental overview
Absence of data or economic flow on Friday has left the Euro trading sideways as the new week gets going. Key standouts on Monday’s calendar come from the German current account, US consumer inflation expectations, and some scattered central bank speak.EURUSD - Technical charts in detail
GBPUSD – technical overview
Signs have emerged of the market wanting to put in a longer-term base after collapsing to a record low in September 2022. The November 2022 monthly close back above 1.2000 strengthens this prospect. Any setbacks should now be well supported ahead of 1.2000. Next key resistance comes in at 1.2429.GBPUSD – fundamental overview
UK GDP flatlines and other data points failed to impress, including industrial production and manufacturing production. Key standouts on Monday’s calendar come from the German current account, US consumer inflation expectations, and some scattered central bank speak.USDJPY – technical overview
At this stage, it looks like the market is wanting to resume the bigger picture uptrend and head back towards a retest of that multi-year high from October 2022 up at 151.95. Look for any weakness to continue to be well supported on dips.USDJPY – fundamental overview
There had been expectations of a potential gesture towards a shift in the BOJ monetary policy outlook. But these expectations have since been let down in recent days, with the central bank holding to its ultra accommodative stance. This along with some softer Japan inflation data has opened fresh lows in the Yen, now on the verge of sinking below the 2022 low against the Buck to a new multi-year low. Key standouts on Monday’s calendar come from the German current account, US consumer inflation expectations, and some scattered central bank speak.AUDUSD – technical overview
There are signs of the potential formation of a longer-term base with the market trading down into a meaningful longer-term support zone. Only a monthly close below 0.6200 would give reason for rethink. Back above 0.6523 will take the immediate pressure off the downside and strengthen case for a bottom.AUDUSD – fundamental overview
Declines in metals and Asia Pacific FX have weighed on the Australian Dollar despite the latest hawkish RBA statement on monetary policy. Key standouts on Monday’s calendar come from the German current account, US consumer inflation expectations, and some scattered central bank speak.USDCAD – technical overview
Above 1.3000 signals an end to a period of longer-term bearish consolidation and suggests the market is in the process of carving out a more significant longer-term base. Next key resistance now comes in up into the 1.4000 area. Setbacks should be very well supported down into the 1.3000 area.USDCAD – fundamental overview
The Canadian Dollar remains well offered overall on the back of a recent run of developments including a more dovish leaning Bank of Canada, softer Canada economic data, and some setbacks in the price of oil. Key standouts on Monday’s calendar come from the German current account, US consumer inflation expectations, and some scattered central bank speak.NZDUSD – technical overview
Overall pressure remains on the downside with the market once again stalling out on a run up into the 0.6500 area. Ultimately, a break back above 0.6056 would be required to take the immediate pressure off the downside. A monthly close below 0.5800 will intensify bearish price action.NZDUSD – fundamental overview
The New Zealand Dollar has been trying to shrug off a weak round of manufacturing PMIs. The latest reading saw the eighth month in contraction. Higher US equities have been helping to offset Kiwi downside. Key standouts on Monday’s calendar come from the German current account, US consumer inflation expectations, and some scattered central bank speak.US SPX 500 – technical overview
Longer-term technical studies are in the process of unwinding from extended readings off record highs. Look for rallies to be well capped in favor of lower tops and lower lows. A monthly close back above 4500 will be required to take the immediate pressure off the downside. Next key support comes in at 4308.US SPX 500 – fundamental overview
Investors continue to struggle with the reality of a higher for longer Fed policy track in the face of ongoing worry around inflation, while also contending with an escalation in geopolitical risk. Overall, we expect inflation to continue to be a problem in 2023 that results in downside pressure into rallies despite market expectations that would argue otherwise.GOLD (SPOT) – technical overview
The 2019 breakout above the 2016 high at 1375 was a significant development, opening the door for fresh record highs. Setbacks should now be well supported above 1600 on a monthly close basis ahead of the next major upside extension. Next major resistance comes in at 2100, above which opens the next extension towards 2500.GOLD (SPOT) – fundamental overview
The yellow metal continues to be well supported on dips with solid demand from medium and longer-term accounts. These players are more concerned about inflation risk and a less stable and upbeat global growth outlook. All of this should keep the commodity well supported, with many market participants also fleeing to the hard asset as the grand dichotomy of record high equities and record low yields comes to an unnerving climax.