


Next 24 hours: Markets more cautious into North American session
Today’s report: Three concerns about the risk on run
The main takeaway this week is the market once again repricing Fed expectations on the back of a welcome round of softer inflation data. The hope is that all of this will translate to more investor friendly monetary policy.
Wake-up call
- court ruling
- UK inflation
- soft GDP
- AUDUSDAussie employment comes in mixed
- manufacturing sales
- card spending
- about inflation
- Global outlook
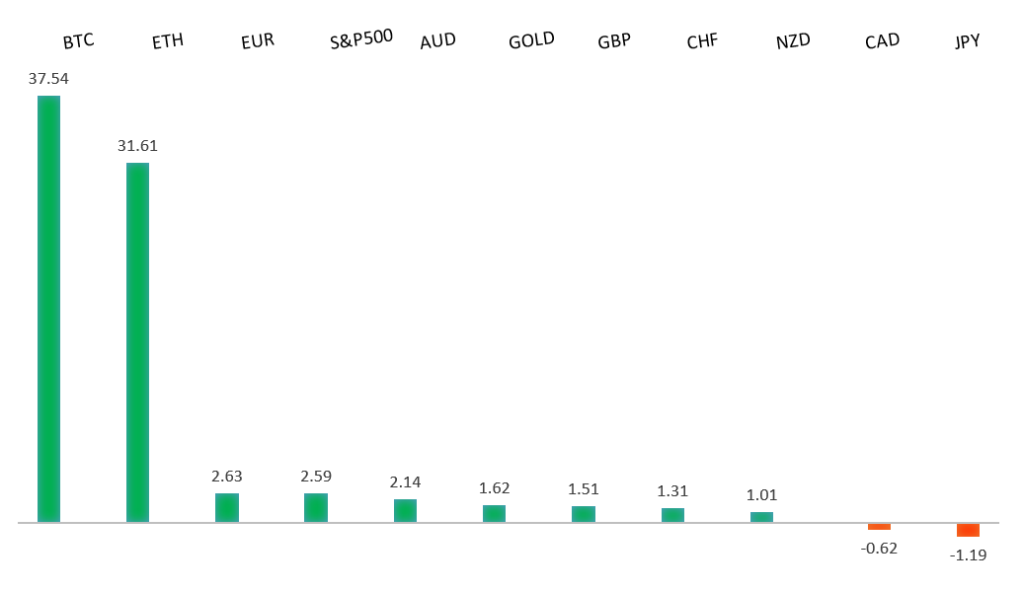
Peformance chart: 30 Day Performance vs. US dollar (%)
Suggested reading
- It's Too Early For The Fed To Declare Victory, C. Roche, Discipline Funds (November 14, 2023)
- The Top Shortlisted Companies 2023, N. Hawcock, Financial Times (November 15, 2023)
Chart talk: Technical & fundamental highlights
Choose pair:
EURUSD – technical overview
The Euro has been in a multi-month consolidation since bottoming out in 2022. Setbacks have since been exceptionally well supported on dips below 1.0500, with a higher platform sought out ahead of the next major upside extension. Look for a push through the yearly high at 1.1276 to strengthen the constructive outlook and extend the recovery run towards 1.2000. Only back below 1.0400 negates.EURUSD – fundamental overview
The Euro run stalled out on Wednesday on softer local data and some news out of the German courts. Softer data included German wholesale prices, French unemployment, and Eurozone industrial production. The German constitutional court ruled the coalition government's decision to re-allocate 60bln Euro of unused debt from the pandemic era to its climate and transformation fund was unconstitutional. Key standouts on Thursday’s calendar come from US data reads in the form of initial jobless claims, the Philly Fed, industrial production, NAHB housing, and a heavy round of Fed speak.EURUSD - Technical charts in detail
GBPUSD – technical overview
Signs have emerged of the market wanting to put in a longer-term base after collapsing to a record low in September 2022. The November 2022 monthly close back above 1.2000 strengthens this prospect. Any setbacks should now be well supported ahead of 1.2000. Next key resistance comes in at 1.2681.GBPUSD – fundamental overview
A lot of the GBP gains in the aftermath of Tuesday's soft US inflation data were wiped out after UK inflation data came out below forecast on Wednesday. Key standouts on Thursday’s calendar come from US data reads in the form of initial jobless claims, the Philly Fed, industrial production, NAHB housing, and a heavy round of Fed speak.USDJPY – technical overview
The market remains confined to a strong uptrend, with sights set on a retest and break of the multi-year high from 2022 at 151.95. A push through this level will open the next major upside extension towards 155.00. Key support comes in at 147.30, with only a break below to delay the constructive outlook.USDJPY – fundamental overview
Japan GDP came in on the soft side on Wednesday which has only emboldened the prospect the BOJ will continue to maintain a more accommodative policy stance. We've since seen the Yen decline back towards the recent yearly low against the Buck. Key standouts on Thursday’s calendar come from US data reads in the form of initial jobless claims, the Philly Fed, industrial production, NAHB housing, and a heavy round of Fed speak.AUDUSD – technical overview
There are signs of the potential formation of a longer-term base with the market trading down into a meaningful longer-term support zone. Only a monthly close below 0.6200 would give reason for rethink. Back above 0.6523 will take the immediate pressure off the downside and strengthen case for a bottom.AUDUSD – fundamental overview
On Wednesday, Aussie wage growth was in decline, and earlier today, Aussie employment data came in mixed. Rate markets continue to fully price in a hold at the RBA's December policy meeting, while expectations for a rate cut in 2024 remain muted. Key standouts on Thursday’s calendar come from US data reads in the form of initial jobless claims, the Philly Fed, industrial production, NAHB housing, and a heavy round of Fed speak.USDCAD – technical overview
Above 1.3000 signals an end to a period of longer-term bearish consolidation and suggests the market is in the process of carving out a more significant longer-term base. Next key resistance now comes in up into the 1.4000 area. Setbacks should be very well supported down into the 1.3000 area.USDCAD – fundamental overview
The Canadian Dollar tried to extend its recent recovery on better than expected Canada manufacturing sales, before coming back under pressure on oil declines and a deterioration in risk sentiment. Key standouts on Thursday’s calendar come from US data reads in the form of initial jobless claims, the Philly Fed, industrial production, NAHB housing, and a heavy round of Fed speak.NZDUSD – technical overview
Overall pressure remains on the downside with the market once again stalling out on a run up into the 0.6500 area. At the same time, there are some signs of the market wanting to put in a longer-term base. Ultimately, a break back above 0.6056 would be required to take the immediate pressure off the downside and encourage this prospect. A monthly close below 0.5800 will intensify bearish price action.NZDUSD – fundamental overview
Local credit card spending data came in soft the other day. At the same time, risk sentiment has cooled off following the run up post US inflation earlier in the week. The New Zealand Dollar has since sold off as a consequence. Key standouts on Thursday’s calendar come from US data reads in the form of initial jobless claims, the Philly Fed, industrial production, NAHB housing, and a heavy round of Fed speak.US SPX 500 – technical overview
Longer-term technical studies are in the process of unwinding from extended readings off record highs. Look for rallies to be well capped in favor of lower tops and lower lows. A monthly close back above 4500 will be required to take the immediate pressure off the downside. Next key support comes in at 4308.US SPX 500 – fundamental overview
Investors continue to struggle with the reality of a higher for longer Fed policy track in the face of ongoing worry around inflation, while also contending with geopolitical risk. Overall, we expect inflation to continue to be a problem in 2023 that results in downside pressure into rallies despite recent data and market expectations that would argue otherwise.GOLD (SPOT) – technical overview
The 2019 breakout above the 2016 high at 1375 was a significant development, opening the door for fresh record highs. Setbacks should now be well supported above 1600 on a monthly close basis ahead of the next major upside extension. Next major resistance comes in at 2100, above which opens the next extension towards 2500.GOLD (SPOT) – fundamental overview
The yellow metal continues to be well supported on dips with solid demand from medium and longer-term accounts. These players are more concerned about inflation risk and a less stable and upbeat global growth outlook. All of this should keep the commodity well supported, with many market participants also fleeing to the hard asset as the grand dichotomy of record high equities and record low yields comes to an unnerving climax.