


Next 24 hours: Yen gains stand out as week gets going
Today’s report: Fed still hasn’t bent to the will of the market
We have yet to get any confirmation or even signs out from the Federal Reserve that there will be an adjustment of monetary policy away from the higher for longer mantra, and yet, the market hasn’t cared.
Wake-up call
- ECB Wunsch
- BOE Bailey
- Yield differentials
- RMB strength
- Oil rebound
- Risk sentiment
- about inflation
- Global outlook
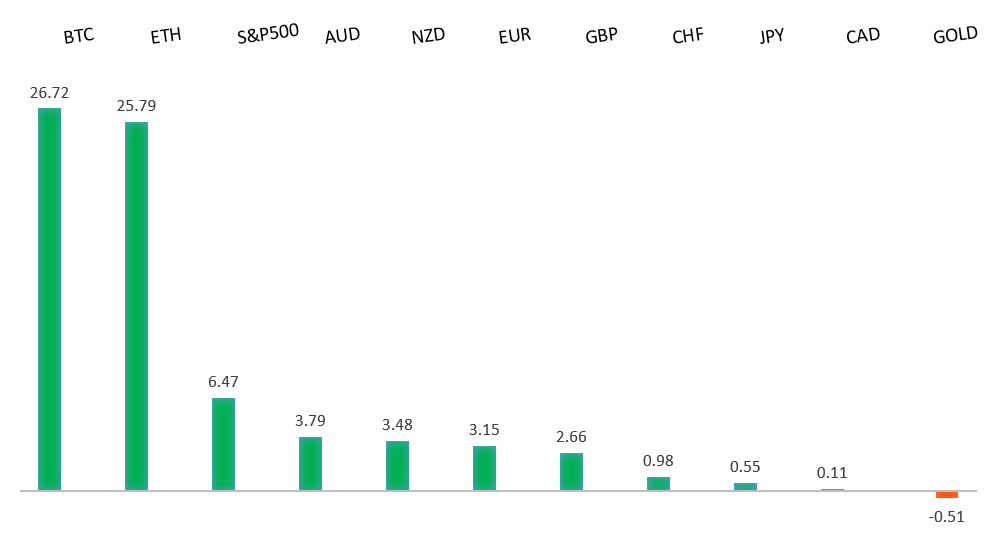
Peformance chart: 30 Day Performance vs. US dollar (%)
Suggested reading
- Why Some Price Deflation May Be Right Around The Corner, N. Irwin, Axios (November 17, 2023)
- Inside the Global Race for Lithium Batteries, S. Mundy, Financial Times (November 20, 2023)
Chart talk: Technical & fundamental highlights
Choose pair:
EURUSD – technical overview
The Euro has been in a multi-month consolidation since bottoming out in 2022. Setbacks have since been exceptionally well supported on dips below 1.0500, with a higher platform sought out ahead of the next major upside extension. Look for a push through the yearly high at 1.1276 to strengthen the constructive outlook and extend the recovery run towards 1.2000. Only back below 1.0400 negates.EURUSD – fundamental overview
A round of hawkish ECB comments have helped to fuel additional demand in the Euro. ECB Wunsch comments stand out after the central banker said the ECB may have to tighten more. Key standouts on Monday’s calendar come from German producer prices, Eurozone construction output, the US conference board leading index, and a BOE Bailey speech.EURUSD - Technical charts in detail
GBPUSD – technical overview
Signs have emerged of the market wanting to put in a longer-term base after collapsing to a record low in September 2022. The November 2022 monthly close back above 1.2000 strengthens this prospect. Any setbacks should now be well supported ahead of 1.2000. Next key resistance comes in at 1.2681.GBPUSD – fundamental overview
The Pound has held up well despite a round of softer than expected UK retail sales, with the currency benefitting from broad based US Dollar outflows. Key standouts on Monday’s calendar come from German producer prices, Eurozone construction output, the US conference board leading index, and a BOE Bailey speech.USDJPY – technical overview
The market remains confined to a strong uptrend, with sights set on a retest and break of the multi-year high from 2022 at 151.95. A push through this level will open the next major upside extension towards 155.00. Key support comes in at 147.30, with only a break below to delay the constructive outlook.USDJPY – fundamental overview
Yield differentials have been adjusting back in the Yen's favor in recent days on account of a severely oversold Yen, worry about possible intervention, and some broad based profit taking on US Dollar longs. Key standouts on Monday’s calendar come from German producer prices, Eurozone construction output, the US conference board leading index, and a BOE Bailey speech.AUDUSD – technical overview
There are signs of the potential formation of a longer-term base with the market trading down into a meaningful longer-term support zone. Only a monthly close below 0.6200 would give reason for rethink. Back above 0.6630 will take the immediate pressure off the downside and strengthen case for a bottom.AUDUSD – fundamental overview
The RMB jumped to it best levels since July, risk assets have been well supported, and the US Dollar has been getting sold across the board. All of this has contributed to the latest round of Aussie gains. Key standouts on Monday’s calendar come from German producer prices, Eurozone construction output, the US conference board leading index, and a BOE Bailey speech.USDCAD – technical overview
Above 1.3000 signals an end to a period of longer-term bearish consolidation and suggests the market is in the process of carving out a more significant longer-term base. Next key resistance now comes in up into the 1.4000 area. Setbacks should be very well supported down into the 1.3000 area.USDCAD – fundamental overview
Canada industrial product and raw materials prices came in soft, though this was offset by broad based US Dollar outflows, higher stocks and a recovery in the price of oil. Key standouts on Monday’s calendar come from German producer prices, Eurozone construction output, the US conference board leading index, and a BOE Bailey speech.NZDUSD – technical overview
Overall pressure remains on the downside with the market once again stalling out on a run up into the 0.6500 area. At the same time, there are some signs of the market wanting to put in a longer-term base. Ultimately, a break back above 0.6056 would be required to take the immediate pressure off the downside and encourage this prospect. A monthly close below 0.5800 will intensify bearish price action.NZDUSD – fundamental overview
There is very little of note on the domestic data docket in New Zealand this week, with only the trade balance and Q3 real retail sales on tap, possibly leaving focus in the space on offshore matters. Kiwi has been rallying on broad based US Dollar outflows and a surge in stocks. Key standouts on Monday’s calendar come from German producer prices, Eurozone construction output, the US conference board leading index, and a BOE Bailey speech.US SPX 500 – technical overview
Longer-term technical studies are in the process of unwinding from extended readings off record highs. Look for rallies to be well capped in favor of lower tops and lower lows. A monthly close back above 4500 will be required to take the immediate pressure off the downside. Next key support comes in at 4308.US SPX 500 – fundamental overview
Investors continue to struggle with the reality of a higher for longer Fed policy track in the face of ongoing worry around inflation, while also contending with geopolitical risk. Overall, we expect inflation to continue to be a problem in 2023 that results in downside pressure into rallies despite recent data and market expectations that would argue otherwise.GOLD (SPOT) – technical overview
The 2019 breakout above the 2016 high at 1375 was a significant development, opening the door for fresh record highs. Setbacks should now be well supported above 1600 on a monthly close basis ahead of the next major upside extension. Next major resistance comes in at 2100, above which opens the next extension towards 2500.GOLD (SPOT) – fundamental overview
The yellow metal continues to be well supported on dips with solid demand from medium and longer-term accounts. These players are more concerned about inflation risk and a less stable and upbeat global growth outlook. All of this should keep the commodity well supported, with many market participants also fleeing to the hard asset as the grand dichotomy of record high equities and record low yields comes to an unnerving climax.