


Special report: All eyes on the Fed Minutes
Today’s report: Hawks still out and about
Broad based US Dollar weakness continues to bolster market sentiment. Investors have chosen to conclude recent economic data in the US, including softer inflation reads, will translate to a Fed cut. And yet, the Fed has sent no such message.
Wake-up call
- Bundesbank outlook
- tax cuts
- wage increases
- RBA Minutes
- credit creation
- deficit improves
- ignoring Fed
- Global outlook
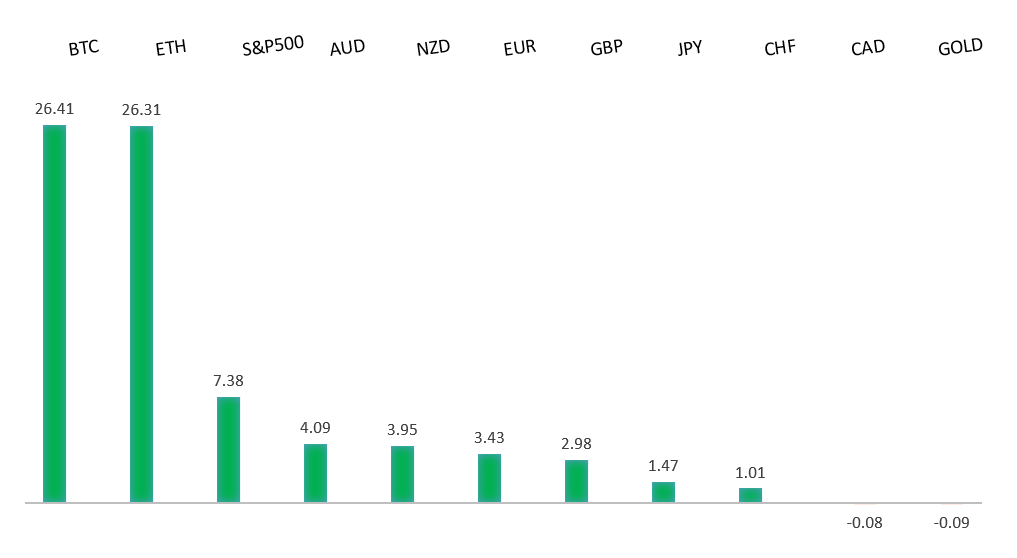
Peformance chart: 30 Day Performance vs. US dollar (%)
Suggested reading
- How Argentines Put a Passionate Free-Marketeer In Power, L. Grinspan, Vox (November 20, 2023)
- Undervaluing Climate Risk, N. Thomas, Financial Times (November 21, 2023)
Chart talk: Technical & fundamental highlights
Choose pair:
EURUSD – technical overview
The Euro has been in a multi-month consolidation since bottoming out in 2022. Setbacks have since been exceptionally well supported on dips below 1.0500, with a higher platform sought out ahead of the next major upside extension. Look for a push through the yearly high at 1.1276 to strengthen the constructive outlook and extend the recovery run towards 1.2000. Only back below 1.0400 negates.EURUSD – fundamental overview
A round of hawkish ECB comments have helped to fuel additional demand in the Euro this week. Both ECB Wunsch and ECB de Cos have expressed their opinions against rate cuts. At the same time, there have been some offers into the rally given the Bundesbank's latest downbeat outlook for the German economy. Key standouts on Tuesday’s calendar come from UK public borrowing, Canada inflation, US existing home sales, and the Fed Minutes.EURUSD - Technical charts in detail
GBPUSD – technical overview
Signs have emerged of the market wanting to put in a longer-term base after collapsing to a record low in September 2022. The November 2022 monthly close back above 1.2000 strengthens this prospect. Any setbacks should now be well supported ahead of 1.2000. Next key resistance comes in at 1.2681.GBPUSD – fundamental overview
The UK government is doing its best to put a positive spin around the anticipation of tax cuts at tomorrow's Chancellor address. The Pound has been in rally mode mostly on the back of this latest wave of broad based US Dollar selling. Key standouts on Tuesday’s calendar come from UK public borrowing, Canada inflation, US existing home sales, and the Fed Minutes.USDJPY – technical overview
The market remains confined to a strong uptrend, with sights set on a retest and break of the multi-year high from 2022 at 151.95. A push through this level will open the next major upside extension towards 155.00. Key support comes in at 147.00, with only a daily close below to delay the constructive outlook.USDJPY – fundamental overview
The short squeeze on the Yen has intensified all while big Japanese corporates are out pledging healthy wage increases next year, which could set the stage for a move towards tighter BOJ policy. Naturally, this could be providing additional fuel to the Yen recovery rally. Key standouts on Tuesday’s calendar come from UK public borrowing, Canada inflation, US existing home sales, and the Fed Minutes.AUDUSD – technical overview
There are signs of the potential formation of a longer-term base with the market trading down into a meaningful longer-term support zone. Only a monthly close below 0.6200 would give reason for rethink. Back above 0.6630 will take the immediate pressure off the downside and strengthen case for a bottom.AUDUSD – fundamental overview
The Australian Dollar has extended its recovery run into Tuesday, getting help from a hawkish read of the RBA Minutes. The meeting minutes noted the 25 basis point rate hike was motivated by possible risks of higher consumer inflation expectations and not achieving the inflation target by 2025. Key standouts on Tuesday’s calendar come from UK public borrowing, Canada inflation, US existing home sales, and the Fed Minutes.USDCAD – technical overview
Above 1.3000 signals an end to a period of longer-term bearish consolidation and suggests the market is in the process of carving out a more significant longer-term base. Next key resistance now comes in up into the 1.4000 area. Setbacks should be very well supported down into the 1.3000 area.USDCAD – fundamental overview
Economic data out of Canada has been discouraging of late, which has been driving relative underperformance in the Canadian Dollar. Weakness in Canada credit creation and household spending is getting a lot of negative attention. Key standouts on Tuesday’s calendar come from UK public borrowing, Canada inflation, US existing home sales, and the Fed Minutes.NZDUSD – technical overview
Overall pressure remains on the downside with the market once again stalling out on a run up into the 0.6500 area. At the same time, there are some signs of the market wanting to put in a longer-term base. Ultimately, a break back above 0.6133 would be required to take the immediate pressure off the downside and encourage this prospect. A monthly close below 0.5800 will intensify bearish price action.NZDUSD – fundamental overview
The recent improvement in the New Zealand trade deficit could relieve some pressure from the New Zealand government to avoid a credit downgrade. This could be factoring into some of the latest run higher in the Kiwi rate. Key standouts on Tuesday’s calendar come from UK public borrowing, Canada inflation, US existing home sales, and the Fed Minutes.US SPX 500 – technical overview
Longer-term technical studies are in the process of unwinding from extended readings off record highs. Look for rallies to be well capped in favor of lower tops and lower lows. A monthly close back above 4600 will be required to take the immediate pressure off the downside. Next key support comes in at 4308.US SPX 500 – fundamental overview
Investors continue to struggle with the reality of a higher for longer Fed policy track in the face of ongoing worry around inflation, while also contending with geopolitical risk in 2023. Overall, we expect inflation to continue to be a problem in 2023 that results in downside pressure into rallies despite recent data and market expectations that would argue otherwise.GOLD (SPOT) – technical overview
The 2019 breakout above the 2016 high at 1375 was a significant development, opening the door for fresh record highs. Setbacks should now be well supported above 1600 on a monthly close basis ahead of the next major upside extension. Next major resistance comes in at 2100, above which opens the next extension towards 2500.GOLD (SPOT) – fundamental overview
The yellow metal continues to be well supported on dips with solid demand from medium and longer-term accounts. These players are more concerned about inflation risk and a less stable and upbeat global growth outlook. All of this should keep the commodity well supported, with many market participants also fleeing to the hard asset as the grand dichotomy of record high equities and record low yields comes to an unnerving climax.