


Today’s report: Surprise Chicago PMI read shakes FX market
Thursday’s booming Chicago PMI print caught the currency market off guard, forcing a repricing of Fed expectations. The data once again reinforces a higher for longer Fed policy trajectory, which in turn has moved yield differentials back in favor of the Buck.
Wake-up call
- soft inflation
- Chicago PMI
- USDJPY Misleading result from Japan jobless rate
- manufacturing PMI
- impressive GDP
- consumer confidence
- ignoring Fed
- Global outlook
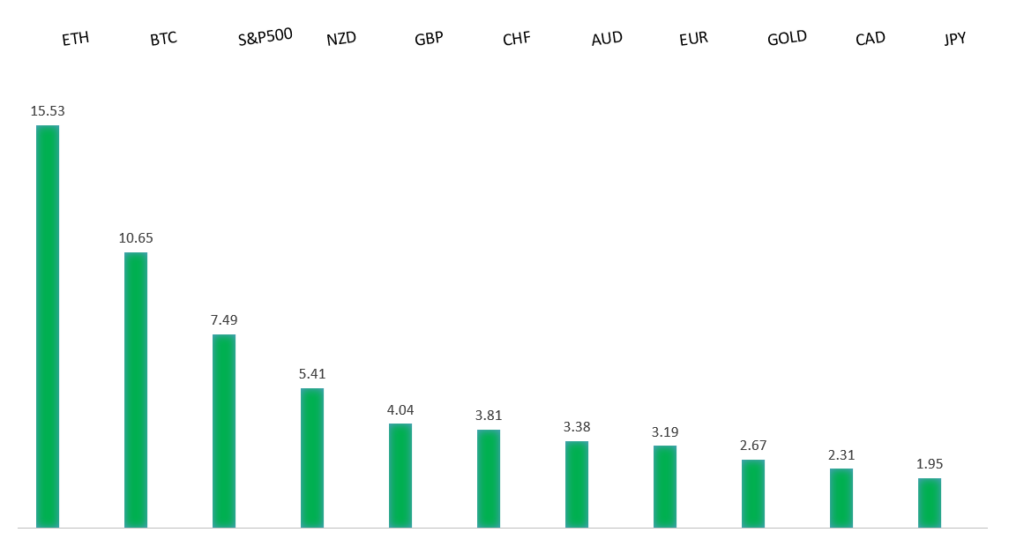
Peformance chart: 30 Day Performance vs. US dollar (%)
Suggested reading
- How Bullish Were You in 2011?, The Big Picture (November 29, 2023)
- The Business of Padel, Financial Times (December 1, 2023)
Chart talk: Technical & fundamental highlights
Choose pair:
EURUSD – technical overview
The Euro has been in a multi-month consolidation since bottoming out in 2022. Setbacks have since been exceptionally well supported on dips below 1.0500, with a higher platform sought out ahead of the next major upside extension. Look for a push through the yearly high at 1.1276 to strengthen the constructive outlook and extend the recovery run towards 1.2000. Only back below 1.0400 negates.EURUSD – fundamental overview
The Euro has taken a hit into the end of the week on the back of a round of softer than expected inflation data out of the Zone, a downgraded outlook for the German and France economies, and dovish ECB speak. Key standouts on Friday’s calendar come from German, Eurozone, and UK PMI reads, Canada employment, US ISM manufacturing, US construction spending, an ECB Lagarde speech, and a Fed Powell speech.EURUSD - Technical charts in detail
GBPUSD – technical overview
Signs have emerged of the market wanting to put in a longer-term base after collapsing to a record low in September 2022. The November 2022 monthly close back above 1.2000 strengthens this prospect. Any setbacks should now be well supported ahead of 1.2000. Next key resistance comes in at 1.2818.GBPUSD – fundamental overview
The Pound didn't get much help from the impressive Lloyds' Bank Business Barometer reading, the best showing since February of 2022. Instead, the currency fell victim to broad based US Dollar demand on the back of a surprise Chicago PMI reading. Key standouts on Friday’s calendar come from German, Eurozone, and UK PMI reads, Canada employment, US ISM manufacturing, US construction spending, an ECB Lagarde speech, and a Fed Powell speech.USDJPY – technical overview
The market remains confined to a strong uptrend, with sights set on a retest and break of the multi-year high from 2022 at 151.95. A push through this level will open the next major upside extension towards 155.00. Key support comes in at 145.00, with only a weekly close below to delay the constructive outlook.USDJPY – fundamental overview
Despite the decline in the Japan jobless rate, labor force participation fell from 63.3% to 63.1%, suggesting the modest decrease was likely a result of the fall in the total labor force as opposed to an actual improvement in employment. Key standouts on Friday’s calendar come from German, Eurozone, and UK PMI reads, Canada employment, US ISM manufacturing, US construction spending, an ECB Lagarde speech, and a Fed Powell speech.AUDUSD – technical overview
There are signs of the potential formation of a longer-term base with the market trading down into a meaningful longer-term support zone. Only a monthly close below 0.6200 would give reason for rethink. Back above 0.6900 will take the big picture pressure off the downside and strengthen case for a bottom.AUDUSD – fundamental overview
Aussie manufacturing PMI data was unchanged, while China PMI data came in on the better side of expectation. On net, Aussie has been more offered into the end of the week on the back of renewed broad based demand for the US Dollar. Key standouts on Friday’s calendar come from German, Eurozone, and UK PMI reads, Canada employment, US ISM manufacturing, US construction spending, an ECB Lagarde speech, and a Fed Powell speech.USDCAD – technical overview
Above 1.3000 signals an end to a period of longer-term bearish consolidation and suggests the market is in the process of carving out a more significant longer-term base. Next key resistance now comes in up into the 1.4000 area. Setbacks should be very well supported down into the 1.3000 area.USDCAD – fundamental overview
The Canadian Dollar is better bid into Friday on the back of a stronger than expected Canada GDP showing on Thursday. Key standouts on Friday’s calendar come from German, Eurozone, and UK PMI reads, Canada employment, US ISM manufacturing, US construction spending, an ECB Lagarde speech, and a Fed Powell speech.NZDUSD – technical overview
Overall pressure remains on the downside with the market continuing to stall out on runs up into the 0.6500 area. At the same time, there are some signs of the market wanting to put in a longer-term base. Ultimately, a break back above 0.6500 would be required to take the medium-term pressure off the downside and encourage this prospect. A monthly close below 0.5800 will intensify bearish price action.NZDUSD – fundamental overview
The RBNZ has continued with its hawkish rhetoric in the aftermath of this week's hawkish hold, while New Zealand consumer confidence has improved to a two year high. This has contributed to a run of relative strength in the New Zealand Dollar. Key standouts on Friday’s calendar come from German, Eurozone, and UK PMI reads, Canada employment, US ISM manufacturing, US construction spending, an ECB Lagarde speech, and a Fed Powell speech.US SPX 500 – technical overview
Longer-term technical studies are in the process of unwinding from extended readings off record highs. Look for rallies to be well capped in favor of lower tops and lower lows. A monthly close back above 4600 will be required to take the immediate pressure off the downside. Next key support comes in at 4308.US SPX 500 – fundamental overview
Investors continue to struggle with the reality of a higher for longer Fed policy track in the face of ongoing worry around inflation, while also contending with geopolitical risk in 2023. Overall, we expect inflation to continue to be a problem in 2023 that results in downside pressure into rallies despite recent data and market expectations that would argue otherwise.GOLD (SPOT) – technical overview
The 2019 breakout above the 2016 high at 1375 was a significant development, opening the door for fresh record highs. Setbacks should now be well supported above 1600 on a monthly close basis ahead of the next major upside extension. Next major resistance comes in at 2100, above which opens the next extension towards 2500.GOLD (SPOT) – fundamental overview
The yellow metal continues to be well supported on dips with solid demand from medium and longer-term accounts. These players are more concerned about inflation risk and a less stable and upbeat global growth outlook. All of this should keep the commodity well supported, with many market participants also fleeing to the hard asset as the grand dichotomy of record high equities and record low yields comes to an unnerving climax.