


Special report: Previewing the BOE and ECB policy decisions
Today’s report: Fed bends to the will of the market
The Fed has finally done what they hadn’t done for many months. The central gave in and bent to the will of the market. On Wednesday, the Fed came out and downgraded its guidance on growth, inflation and rates.
Wake-up call
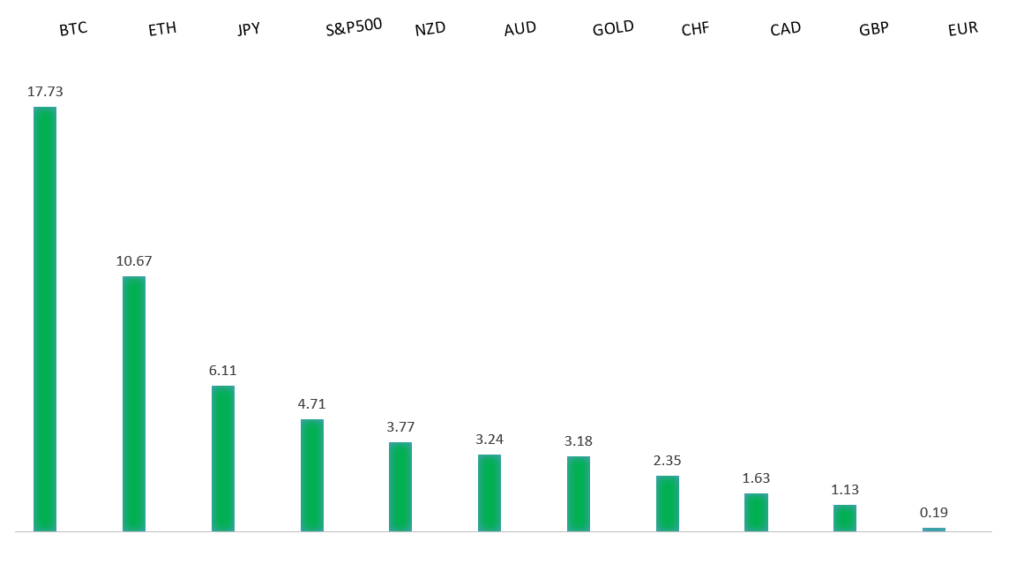
Peformance chart: 30 Day Performance vs. US dollar (%)
Suggested reading
- The Advantage for Stocks When Inflation Rises, Morningstar (December 11, 2023)
- Big deals in US shale may not mean boom times are back, Financial Times (December 13, 2023)
Chart talk: Technical & fundamental highlights
Choose pair:
EURUSD – technical overview
The Euro has been in a multi-month consolidation since bottoming out in 2022. Setbacks have since been exceptionally well supported on dips below 1.0500, with a higher platform sought out ahead of the next major upside extension. Look for a push through the yearly high at 1.1276 to strengthen the constructive outlook and extend the recovery run towards 1.2000. Only back below 1.0400 negates.EURUSD – fundamental overview
The Euro did a good job recovering from early Wednesday weakness on the back of a three year low in Eurozone industrial production. Clearly the dovish Fed decision has been the driving force here as yield differentials move aggressively back towards the Euro. Key standouts on Thursday’s calendar come from the BOE policy decision, ECB policy decision, US retail sales, initial jobless claims, and business inventories.EURUSD - Technical charts in detail
GBPUSD – technical overview
Signs have emerged of the market wanting to put in a longer-term base after collapsing to a record low in September 2022. The November 2022 monthly close back above 1.2000 strengthens this prospect. Any setbacks should now be well supported ahead of 1.2000. Next key resistance comes in at 1.2818.GBPUSD – fundamental overview
The Pound has traded higher in the aftermath of the dovish Fed decision. However, gains have been mitigated on a wave of soft UK data including GDP, industrial production and manufacturing production. The market is now pricing 100 basis points of rate cuts in 2024. Key standouts on Thursday’s calendar come from the BOE policy decision, ECB policy decision, US retail sales, initial jobless claims, and business inventories.USDJPY – technical overview
The market remains confined to a strong uptrend, with sights set on a retest and break of the multi-year high from 2022 at 151.95. A push through this level will open the next major upside extension towards 155.00. Key support comes in at 140.00, with only a weekly close below to delay the constructive outlook.USDJPY – fundamental overview
The combination of a market that is taking the possibility for a BOJ pivot more seriously and Wednesday's dovish FOMC decision, is a combination that has resulted in a surge in Yen demand, with those gains extending into Thursday. Key standouts on Thursday’s calendar come from the BOE policy decision, ECB policy decision, US retail sales, initial jobless claims, and business inventories.AUDUSD – technical overview
There are signs of the potential formation of a longer-term base with the market trading down into a meaningful longer-term support zone. Only a monthly close below 0.6200 would give reason for rethink. Back above 0.6900 will take the big picture pressure off the downside and strengthen case for a bottom.AUDUSD – fundamental overview
The Australian Dollar has built on its post dovish Fed momentum from Wednesday, adding to the rally after the Aussie jobs report came in stronger than expected early Thursday. Key standouts on Thursday’s calendar come from the BOE policy decision, ECB policy decision, US retail sales, initial jobless claims, and business inventories.USDCAD – technical overview
Above 1.3000 signals an end to a period of longer-term bearish consolidation and suggests the market is in the process of carving out a more significant longer-term base. Next key resistance now comes in up into the 1.4000 area. Setbacks should be very well supported down into the 1.3000 area.USDCAD – fundamental overview
A new report showing the Canada household debt service ratio rising to a record high has been shrugged off, with the bigger focus on US Dollar selling post the dovish Fed decision and a recovery in the price of oil. Key standouts on Thursday’s calendar come from the BOE policy decision, ECB policy decision, US retail sales, initial jobless claims, and business inventories.NZDUSD – technical overview
Overall pressure remains on the downside with the market continuing to stall out on runs up into the 0.6500 area. At the same time, there are some signs of the market wanting to put in a longer-term base. Ultimately, a break back above 0.6500 would be required to take the medium-term pressure off the downside and encourage this prospect. A monthly close below 0.5800 will intensify bearish price action.NZDUSD – fundamental overview
The New Zealand Dollar has done a good job shrugging off today's much softer than expected New Zealand growth data, instead focusing on the bigger picture macro flows that have been supportive of risk correlated assets post dovish Fed decision. Key standouts on Thursday’s calendar come from the BOE policy decision, ECB policy decision, US retail sales, initial jobless claims, and business inventories.US SPX 500 – technical overview
Longer-term technical studies continue to look quite extended, begging for a deeper correction ahead. Look for rallies to be well capped in favor of lower tops and lower lows. A monthly close back above 4800 will be required to delay the outlook. Next key support comes in at 4536.US SPX 500 – fundamental overview
The Fed has finally bent to the will of the market into year end, with the December policy decision revealing rate projections coming down from previous and more in line with what the market has been looking for. This has translated to more investor friendly policy going forward, which could now open the door for a run to fresh record highs in 2024. At the same time, we worry inflation remains a risk both the market and Fed are not taking as seriously as needed, which could once again force the Fed back into a more restrictive path and weigh heavily on stocks.GOLD (SPOT) – technical overview
The 2019 breakout above the 2016 high at 1375 was a significant development, opening the door for fresh record highs. Setbacks should now be well supported above 1900 on a monthly close basis ahead of the next major upside extension towards 2500.GOLD (SPOT) – fundamental overview
The yellow metal continues to be well supported on dips with solid demand from medium and longer-term accounts. These players are more concerned about inflation risk and a less stable and upbeat global growth outlook. All of this should keep the commodity well supported, with many market participants also fleeing to the hard asset as the grand dichotomy of record high equities and record low yields comes to an unnerving climax.