


Today’s report: The market keeps doing what it wants to do
The week is set to close out and the big takeaway is that the market continues to see what it wants to see, despite actual signs that would argue otherwise. Key standouts on Friday’s calendar come from the monthly employment report out of the US, US factory orders, and Michigan sentiment.
Wake-up call
- Eurozone inflation
- BOE split
- Hawkish shift
- looks beyond
- BoC Macklem
- sentiment boost
- less dovish
- Macro themes
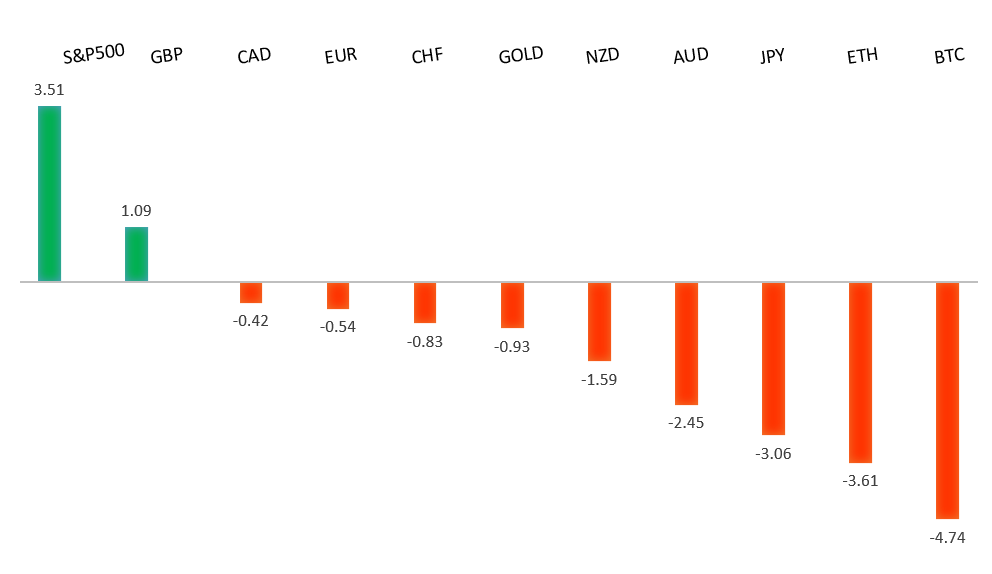
Peformance chart: 30-Day Performance vs. US dollar (%)
Suggested reading
- Why It's Time To Short Stocks, J.C. Parets, All Start Charts (January 31, 2024)
- Why The Video Game Industry Is In Trouble, P. Kafka, Business Insider (February 1, 2024)
Chart talk: Technical & fundamental highlights
Choose pair:
EURUSD – technical overview
The Euro has been in a multi-month consolidation since bottoming out in 2022. Setbacks have since been exceptionally well supported on dips below 1.0500, with a higher platform sought out ahead of the next major upside extension. Look for a push through the 2023 high at 1.1276 to strengthen the constructive outlook and extend the recovery run towards 1.2000. Only back below 1.0400 negates.EURUSD – fundamental overview
The Euro managed to find some solid demand on Thursday on the back of Eurozone inflation data that cooled less than expected, and on the back of some broad based risk on flow. Key standouts on Friday’s calendar come from the monthly employment report out of the US, US factory orders, and Michigan sentiment.EURUSD - Technical charts in detail
GBPUSD – technical overview
Signs have emerged of the market wanting to put in a longer-term base after collapsing to a record low in September 2022. The November 2022 monthly close back above 1.2000 strengthens this prospect. Any setbacks should now be well supported ahead of 1.2000. Next key resistance comes in at 1.2849.GBPUSD – fundamental overview
The split vote from the BOE was behind a lot of the demand for the Pound on Thursday. Many thought the central bank would come in with a unanimous vote to leave rates unchanged. While one member did go ahead and vote for a cut, the fact that two members still voted for a hike was more than enough hawkishness to push the Pound higher. BOE Bailey also pushed back on cuts saying he wanted more evidence with respect to inflation. Key standouts on Friday’s calendar come from the monthly employment report out of the US, US factory orders, and Michigan sentiment.USDJPY – technical overview
The market remains confined to a strong uptrend, with sights set on a retest and break of the multi-year high from 2022 at 151.95. A push through this level will open the next major upside extension towards 155.00. Key support comes in at 140.00, with only a weekly close below to delay the constructive outlook.USDJPY – fundamental overview
The latest round of minor demand for the Yen can be attributed to this week's hawkish BOJ Minutes in which the central bank discussed the need to raise interest rates before the rest of the world starts cutting. It's also possible that we're seeing Yen demand on traditional correlations with risk off flow. Key standouts on Friday’s calendar come from the monthly employment report out of the US, US factory orders, and Michigan sentiment.AUDUSD – technical overview
There are signs of the potential formation of a longer-term base with the market trading down into a meaningful longer-term support zone. Only a monthly close below 0.6200 would give reason for rethink. Back above 0.6900 will take the big picture pressure off the downside and strengthen case for a bottom.AUDUSD – fundamental overview
The Australian Dollar has done a good job forgetting a round of softer Thursday Aussie data, instead pushing back to the topside as global risk assets put in an impressive recovery. Key standouts on Friday’s calendar come from the monthly employment report out of the US, US factory orders, and Michigan sentiment.USDCAD – technical overview
Above 1.3000 signals an end to a period of longer-term bearish consolidation and suggests the market is in the process of carving out a more significant longer-term base. Next key resistance now comes in up into the 1.4000 area. Setbacks should be very well supported down into the 1.3000 area.USDCAD – fundamental overview
The Canadian Dollar held up well on Thursday, getting a boost from a pop in Canada manufacturing PMIs, Bank of Canada Macklem downplaying rate cuts, and broad based risk on flow. Gains were however somewhat tempered by the fall in the price of oil. Odds for a BoC March rate cut are now down to about 0%, while odds for an April cut sit at around 40%. Key standouts on Friday’s calendar come from the monthly employment report out of the US, US factory orders, and Michigan sentiment.NZDUSD – technical overview
Overall pressure remains on the downside with the market continuing to stall out on runs up into the 0.6500 area. At the same time, there are some signs of the market wanting to put in a longer-term base. Ultimately, a break back above 0.6500 would be required to take the medium-term pressure off the downside and encourage this prospect. A monthly close below 0.5800 will intensify bearish price action.NZDUSD – fundamental overview
The New Zealand is getting a boost into Friday as the US Dollar sells off and risk assets recovery. Key standouts on Friday’s calendar come from the monthly employment report out of the US, US factory orders, and Michigan sentiment.US SPX 500 – technical overview
Longer-term technical studies continue to look quite extended after pushing to fresh record highs, begging for a deeper correction ahead. Look for rallies to be well capped in favor of lower tops and lower lows. A monthly close back above 4900 will be required to delay the outlook. Next key support comes in at 4714.US SPX 500 – fundamental overview
The Fed has finally bent to the will of the market, with the December 2023 policy decision revealing rate projections coming down from previous and more in line with what the market has been looking for. This has translated to more investor friendly policy going forward, opening the door for a run to fresh record highs in early 2024. At the same time, the central bank is still not willing to fully play into market expectations for aggressive rate cuts to the tune of 6 in 2024, which could prove to be a disappointment for investors and start to weigh on stocks.GOLD (SPOT) – technical overview
The 2019 breakout above the 2016 high at 1375 was a significant development, opening the door for fresh record highs. Setbacks should now be well supported above 1900 on a monthly close basis ahead of the next major upside extension towards 2500.GOLD (SPOT) – fundamental overview
The yellow metal continues to be well supported on dips with solid demand from medium and longer-term accounts. These players are more concerned about inflation risk and a less stable and upbeat global growth outlook. All of this should keep the commodity well supported, with many market participants also fleeing to the hard asset as the grand dichotomy of record high equities and record low yields comes to an unnerving climax.