


Next 24 hours: Yen hit hard on dovish BOJ comments
Today’s report: US stocks extend run of record highs
The Fed has been quite vocal about pushing back on the need for imminent rate cuts. At the same time, the threat of regional bank contagion has been getting a little more attention. And yet, we continue to see investors dismissing any signs that might have stocks and risk assets wanting to go lower.
Wake-up call
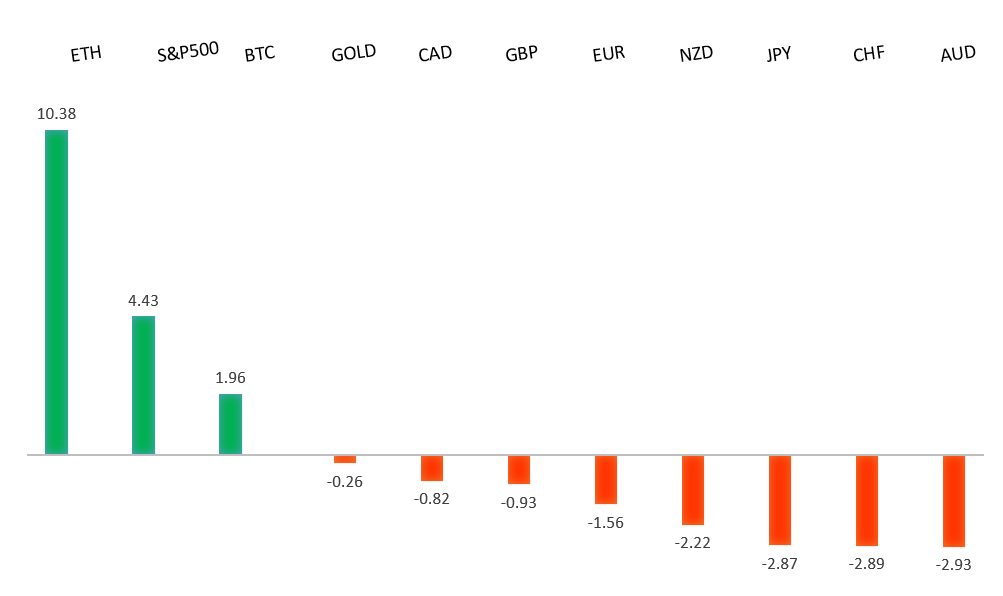
Peformance chart: 30-Day Performance vs. US dollar (%)
Suggested reading
- Javier Milei’s Bid for Economic Freedom, P. Schwennesen, AIER (February 5, 2024)
- Powell Didn’t Break Any Real News On 60 Minutes, Fisher Investments (February 5, 2024)
Chart talk: Technical & fundamental highlights
Choose pair:
EURUSD – technical overview
The Euro has been in a multi-month consolidation since bottoming out in 2022. Setbacks have since been exceptionally well supported on dips below 1.0500, with a higher platform sought out ahead of the next major upside extension. Look for a push through the 2023 high at 1.1276 to strengthen the constructive outlook and extend the recovery run towards 1.2000. Only back below 1.0400 negates.EURUSD – fundamental overview
The Euro has done a good job trying to recover in the face of economic data that has mostly been on the softer side this week. Wednesday's German industrial production came in a good deal weaker than forecast. Ultimately, it seems most of the supportive flow is coming from broad based US Dollar selling rather than any specific demand for the single currency. Key standouts on Thursday’s calendar come from US initial jobless claims and a batch of central bank speak across the Fed, BOE, and ECB.EURUSD - Technical charts in detail
GBPUSD – technical overview
Signs have emerged of the market wanting to put in a longer-term base after collapsing to a record low in September 2022. The November 2022 monthly close back above 1.2000 strengthens this prospect. Any setbacks should now be well supported ahead of 1.2000. Next key resistance comes in at 1.2849.GBPUSD – fundamental overview
The Pound has had reason to celebrate in recent sessions. UK house prices rose at their quickest pace since 2022, while BOE Breeden has said the central bank is likely to wait before cutting rates, reflecting her confidence in the UK economy. Key standouts on Thursday’s calendar come from US initial jobless claims and a batch of central bank speak across the Fed, BOE, and ECB.USDJPY – technical overview
The market remains confined to a strong uptrend, with sights set on a retest and break of the multi-year high from 2022 at 151.95. A push through this level will open the next major upside extension towards 155.00. Key support comes in at 140.00, with only a weekly close below to delay the constructive outlook.USDJPY – fundamental overview
We've seen renewed selling pressure on the Yen into Thursday, perhaps on the back of the latest surge in US equities to record highs. On the data front, Japan's current account narrowed by more than expected. Key standouts on Thursday’s calendar come from US initial jobless claims and a batch of central bank speak across the Fed, BOE, and ECB.AUDUSD – technical overview
There are signs of the potential formation of a longer-term base with the market trading down into a meaningful longer-term support zone. Only a monthly close below 0.6200 would give reason for rethink. Back above 0.6900 will take the big picture pressure off the downside and strengthen case for a bottom.AUDUSD – fundamental overview
The Australian Dollar hasn't been trading all that impressively when considering a hawkish RBA decision, solid Aussie retail sales, record high US equities and a sentiment boost in China. Key standouts on Thursday’s calendar come from US initial jobless claims and a batch of central bank speak across the Fed, BOE, and ECB.USDCAD – technical overview
Above 1.3000 signals an end to a period of longer-term bearish consolidation and suggests the market is in the process of carving out a more significant longer-term base. Next key resistance now comes in up into the 1.4000 area. Setbacks should be very well supported down into the 1.3000 area.USDCAD – fundamental overview
The Canada trade balance swung to a small deficit though the Canadian Dollar has held up relatively well on the back of a rally in the price of oil. Key standouts on Thursday’s calendar come from US initial jobless claims and a batch of central bank speak across the Fed, BOE, and ECB.NZDUSD – technical overview
Overall pressure remains on the downside with the market continuing to stall out on runs up into the 0.6500 area. At the same time, there are some signs of the market wanting to put in a longer-term base. Ultimately, a break back above 0.6500 would be required to take the medium-term pressure off the downside and encourage this prospect. A monthly close below 0.5800 will intensify bearish price action.NZDUSD – fundamental overview
The New Zealand Dollar sis trying to hold onto gains from a slighter better than expected Kiwi jobs report from Wednesday. But just as with the Australian Dollar, the Kiwi rate has been less than impressive when considering surging US equities to record highs and a better vibe in China. Key standouts on Thursday’s calendar come from US initial jobless claims and a batch of central bank speak across the Fed, BOE, and ECB.US SPX 500 – technical overview
Longer-term technical studies continue to look quite extended after pushing to fresh record highs, begging for a deeper correction ahead. Look for rallies to be well capped in favor of lower tops and lower lows. A monthly close above 5000 will be required to delay the outlook. Next key support comes in at 4842.US SPX 500 – fundamental overview
The Fed has finally bent to the will of the market, with the December 2023 policy decision revealing rate projections coming down from previous and more in line with what the market has been looking for. This has translated to more investor friendly policy going forward, opening the door for a run to fresh record highs in early 2024. At the same time, the central bank is still not willing to fully play into market expectations for aggressive rate cuts to the tune of 6 in 2024, which could prove to be a disappointment for investors and start to weigh on stocks.GOLD (SPOT) – technical overview
The 2019 breakout above the 2016 high at 1375 was a significant development, opening the door for fresh record highs. Setbacks should now be well supported above 1900 on a monthly close basis ahead of the next major upside extension towards 2500.GOLD (SPOT) – fundamental overview
The yellow metal continues to be well supported on dips with solid demand from medium and longer-term accounts. These players are more concerned about inflation risk and a less stable and upbeat global growth outlook. All of this should keep the commodity well supported, with many market participants also fleeing to the hard asset as the grand dichotomy of record high equities and record low yields comes to an unnerving climax.