


Today’s report: Why it’s been hard to reconcile market behavior
The big takeaway this week is the striking disconnect between the messages we’re getting and the market’s response. By most indications, economic data and central bank speak have backed up the case for a less accommodative Fed rate cut path than what the market has been pricing.
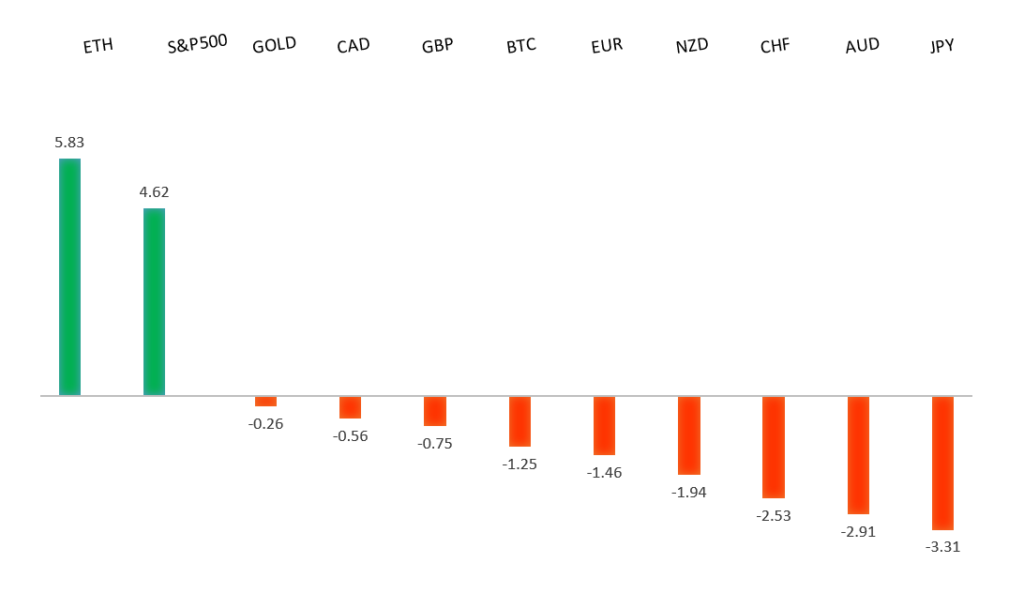
Wake-up call
Peformance chart: 30-Day Performance vs. US dollar (%)
Suggested reading
- 6 Undervalued Stocks That Just Raised Dividends, T. Lauricella, Morningstar (February 5, 2024)
- Fed Says Record Losses Don’t Matter, N. Cachanosky, AEIR (February 5, 2024)
Chart talk: Technical & fundamental highlights
Choose pair:
EURUSD – technical overview
The Euro has been in a multi-month consolidation since bottoming out in 2022. Setbacks have since been exceptionally well supported on dips below 1.0500, with a higher platform sought out ahead of the next major upside extension. Look for a push through the 2023 high at 1.1276 to strengthen the constructive outlook and extend the recovery run towards 1.2000. Only back below 1.0400 negates.EURUSD – fundamental overview
The Euro comes into Friday trading rather subdued on account of a light Thursday sessions of trade with no meaningful data points. Key standouts on Friday’s calendar come from German inflation, the Canada jobs report, US CPI revisions, and some Fed speak.EURUSD - Technical charts in detail
GBPUSD – technical overview
Signs have emerged of the market wanting to put in a longer-term base after collapsing to a record low in September 2022. The November 2022 monthly close back above 1.2000 strengthens this prospect. Any setbacks should now be well supported ahead of 1.2000. Next key resistance comes in at 1.2849.GBPUSD – fundamental overview
The Pound has held up well on the back of rising UK rates after the RICS house price balance rose for a fifth month. Key standouts on Friday’s calendar come from German inflation, the Canada jobs report, US CPI revisions, and some Fed speak.USDJPY – technical overview
The market remains confined to a strong uptrend, with sights set on a retest and break of the multi-year high from 2022 at 151.95. A push through this level will open the next major upside extension towards 155.00. Key support comes in at 140.00, with only a weekly close below to delay the constructive outlook.USDJPY – fundamental overview
The Yen has extended its 2024 slide on the back of dovish BOJ comments that rapid rate increases would be unlikely after negative interest rate policy. Key standouts on Friday’s calendar come from German inflation, the Canada jobs report, US CPI revisions, and some Fed speak.AUDUSD – technical overview
There are signs of the potential formation of a longer-term base with the market trading down into a meaningful longer-term support zone. Only a monthly close below 0.6200 would give reason for rethink. Back above 0.6900 will take the big picture pressure off the downside and strengthen case for a bottom.AUDUSD – fundamental overview
The Australian Dollar has been struggling with news out of China after China CPI fell at its fastest pace since 2009. This has also opened downside pressure on metals prices, which has added to the Aussie bearishness. RBA Bullock was on the wires saying the central bank is neither ruling in or ruling out further rate hikes. Key standouts on Friday’s calendar come from German inflation, the Canada jobs report, US CPI revisions, and some Fed speak.USDCAD – technical overview
Above 1.3000 signals an end to a period of longer-term bearish consolidation and suggests the market is in the process of carving out a more significant longer-term base. Next key resistance now comes in up into the 1.4000 area. Setbacks should be very well supported down into the 1.3000 area.USDCAD – fundamental overview
The Canadian Dollar has done a decent job in recent sessions fighting off a wave of broad based US Dollar demand. Thursday surge in the price of oil has been sourced as the primary factor. Key standouts on Friday’s calendar come from German inflation, the Canada jobs report, US CPI revisions, and some Fed speak.NZDUSD – technical overview
Overall pressure remains on the downside with the market continuing to stall out on runs up into the 0.6500 area. At the same time, there are some signs of the market wanting to put in a longer-term base. Ultimately, a break back above 0.6500 would be required to take the medium-term pressure off the downside and encourage this prospect. A monthly close below 0.5800 will intensify bearish price action.NZDUSD – fundamental overview
Comments from ANZ that more RBNZ rate hikes are coming have been driving a wave of Kiwi outperformance on this Friday. ANZ now sees the RBNZ raising rates two more times in 2024. Key standouts on Friday’s calendar come from German inflation, the Canada jobs report, US CPI revisions, and some Fed speak.US SPX 500 – technical overview
Longer-term technical studies continue to look quite extended after pushing to fresh record highs, begging for a deeper correction ahead. Look for rallies to be well capped in favor of lower tops and lower lows. A monthly close above 5000 will be required to delay the outlook. Next key support comes in at 4842.US SPX 500 – fundamental overview
The Fed has finally bent to the will of the market, with the December 2023 policy decision revealing rate projections coming down from previous and more in line with what the market has been looking for. This has translated to more investor friendly policy going forward, opening the door for a run to fresh record highs in early 2024. At the same time, the central bank is still not willing to fully play into market expectations for aggressive rate cuts to the tune of 6 in 2024, which could prove to be a disappointment for investors and start to weigh on stocks.GOLD (SPOT) – technical overview
The 2019 breakout above the 2016 high at 1375 was a significant development, opening the door for fresh record highs. Setbacks should now be well supported above 1900 on a monthly close basis ahead of the next major upside extension towards 2500.GOLD (SPOT) – fundamental overview
The yellow metal continues to be well supported on dips with solid demand from medium and longer-term accounts. These players are more concerned about inflation risk and a less stable and upbeat global growth outlook. All of this should keep the commodity well supported, with many market participants also fleeing to the hard asset as the grand dichotomy of record high equities and record low yields comes to an unnerving climax.