


Next 24 hours: Market gets set for US CPI release
Today’s report: All eyes on US inflation data
We haven’t seen much change in FX markets since the week got going and we talked about a lighter Monday calendar and positioning into today’s US event risk accounting for the directionless trade. Interestingly enough, US equities haven’t stopped doing their thing, continuing to extend their run of record highs.
Wake-up call
- ECB Cipollone
- rates repricing
- producer prices
- AUDUSD
- Expectations repriced
- RBNZ survey
- less dovish
- Macro themes
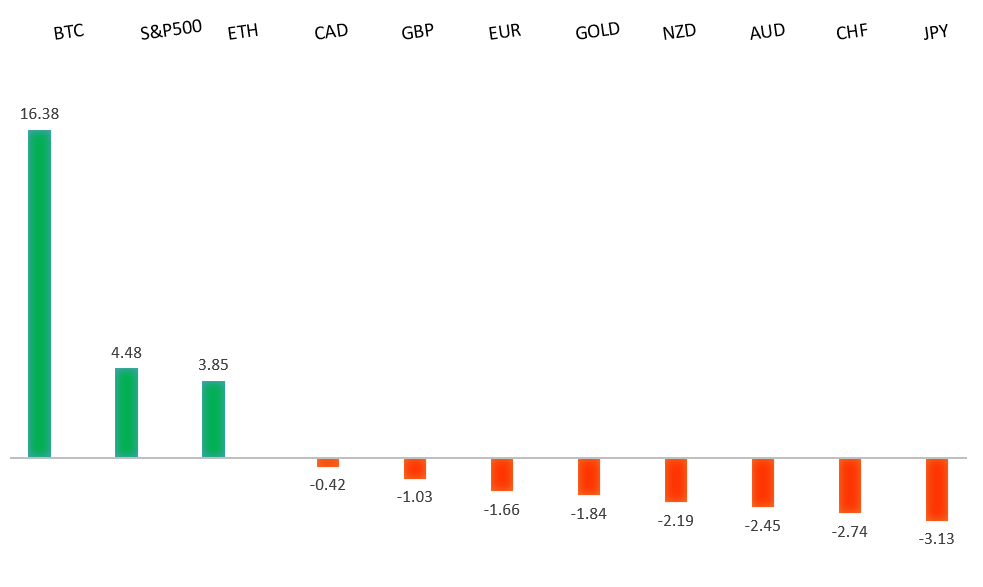
Peformance chart: 30-Day Performance vs. US dollar (%)
Suggested reading
- Sketchy Politics: the rules of the electoral race, R. Shrimsley, Financial Times (February 12, 2024)
- Tale of Two Economies Narrative, P. Mueller, AIER (February 12, 2024)
Chart talk: Technical & fundamental highlights
Choose pair:
EURUSD – technical overview
The Euro has been in a multi-month consolidation since bottoming out in 2022. Setbacks have since been exceptionally well supported on dips below 1.0500, with a higher platform sought out ahead of the next major upside extension. Look for a push through the 2023 high at 1.1276 to strengthen the constructive outlook and extend the recovery run towards 1.2000. Only back below 1.0400 negates.EURUSD – fundamental overview
Things have been rather quiet to start the week, though we did see some Euro selling on Monday from dovish ECB comments. ECB Cipollone talked about weak demand and the fact that there was no need to cause more slack. Key standouts on Tuesday’s calendar come from UK employment, Eurozone and German ZEW reads, ECB speak, and US inflation data.EURUSD - Technical charts in detail
GBPUSD – technical overview
Signs have emerged of the market wanting to put in a longer-term base after collapsing to a record low in September 2022. The November 2022 monthly close back above 1.2000 strengthens this prospect. Any setbacks should now be well supported ahead of 1.2000. Next key resistance comes in at 1.2849.GBPUSD – fundamental overview
The Pound has been better bid of late as the UK rate market makes a significant repricing of BOE rate cut expectations since the beginning of the year. When the year started out, the market was pricing 175 basis points of cuts in 2024. Now, the market is only looking for 75 basis points of cuts in 2024. Key standouts on Tuesday’s calendar come from UK employment, Eurozone and German ZEW reads, ECB speak, and US inflation data.USDJPY – technical overview
The market remains confined to a strong uptrend, with sights set on a retest and break of the multi-year high from 2022 at 151.95. A push through this level will open the next major upside extension towards 155.00. Key support comes in at 140.00, with only a weekly close below to delay the constructive outlook.USDJPY – fundamental overview
Japan producer prices came out higher than expected. Still, the market hasn't reacted to the data is continues to be more focused on last week's comments out from the central bank. Remember, last week, BOJ Ueda said the central bank would leave policy accommodative even after NIRP. The Yen has unsurprisingly been under pressure as a consequence and sits at fresh yearly lows against the Buck. Key standouts on Tuesday’s calendar come from UK employment, Eurozone and German ZEW reads, ECB speak, and US inflation data.AUDUSD – technical overview
There are signs of the potential formation of a longer-term base with the market trading down into a meaningful longer-term support zone. Only a monthly close below 0.6200 would give reason for rethink. Back above 0.6900 will take the big picture pressure off the downside and strengthen case for a bottom.AUDUSD – fundamental overview
Earlier today, Aussie NAB business confidence came out slightly higher, but still well below the long run average. Meanwhile, RBA Kohler talked about the central bank's base case for inflation to return to the target range by 2025, before hitting the mid-point of the 2%-3% band in 2026. Key standouts on Tuesday’s calendar come from UK employment, Eurozone and German ZEW reads, ECB speak, and US inflation data.USDCAD – technical overview
Above 1.3000 signals an end to a period of longer-term bearish consolidation and suggests the market is in the process of carving out a more significant longer-term base. Next key resistance now comes in up into the 1.4000 area. Setbacks should be very well supported down into the 1.3000 area.USDCAD – fundamental overview
We've been seeing an adjustment in Bank of Canada rate cut expectations, with the market getting less dovish and not seeing the first rate cut until July. Key standouts on Tuesday’s calendar come from UK employment, Eurozone and German ZEW reads, ECB speak, and US inflation data.NZDUSD – technical overview
Overall pressure remains on the downside with the market continuing to stall out on runs up into the 0.6500 area. At the same time, there are some signs of the market wanting to put in a longer-term base. Ultimately, a break back above 0.6500 would be required to take the medium-term pressure off the downside and encourage this prospect. A monthly close below 0.5800 will intensify bearish price action.NZDUSD – fundamental overview
The New Zealand Dollar has been underperforming after the RBNZ's survey showed a moderation of inflation expectations. This has cast doubt on ANZ's recent call for two RBNZ rate hikes in 2024. Key standouts on Tuesday’s calendar come from UK employment, Eurozone and German ZEW reads, ECB speak, and US inflation data.US SPX 500 – technical overview
Longer-term technical studies continue to look quite extended after pushing to fresh record highs, begging for a deeper correction ahead. Look for rallies to be well capped in favor of lower tops and lower lows. A monthly close above 5000 will be required to delay the outlook. Next key support comes in at 4842.US SPX 500 – fundamental overview
The Fed has finally bent to the will of the market, with the December 2023 policy decision revealing rate projections coming down from previous and more in line with what the market has been looking for. This has translated to more investor friendly policy going forward, opening the door for a run to fresh record highs in early 2024. At the same time, the central bank is still not willing to fully play into market expectations for aggressive rate cuts to the tune of 6 in 2024, which could prove to be a disappointment for investors and start to weigh on stocks.GOLD (SPOT) – technical overview
The 2019 breakout above the 2016 high at 1375 was a significant development, opening the door for fresh record highs. Setbacks should now be well supported above 1900 on a monthly close basis ahead of the next major upside extension towards 2500.GOLD (SPOT) – fundamental overview
The yellow metal continues to be well supported on dips with solid demand from medium and longer-term accounts. These players are more concerned about inflation risk and a less stable and upbeat global growth outlook. All of this should keep the commodity well supported, with many market participants also fleeing to the hard asset as the grand dichotomy of record high equities and record low yields comes to an unnerving climax.