


Next 24 hours: US producer prices could be a bigger deal today
Today’s report: Getting harder for investors to shrug off the data
Investors have been hit with a series of blows in recent days, all of which have forced a serious reconsideration of Fed rate cut pricing in 2024. The other week, it was the less dovish Fed communication and stronger US jobs report. And this week, it was the hotter than expected US CPI print.
Wake-up call
- Expectation shift
- less dovish
- rapid moves
- sentiment downturn
- US inflation
- stocks slammed
- reconsider bets
- Macro themes
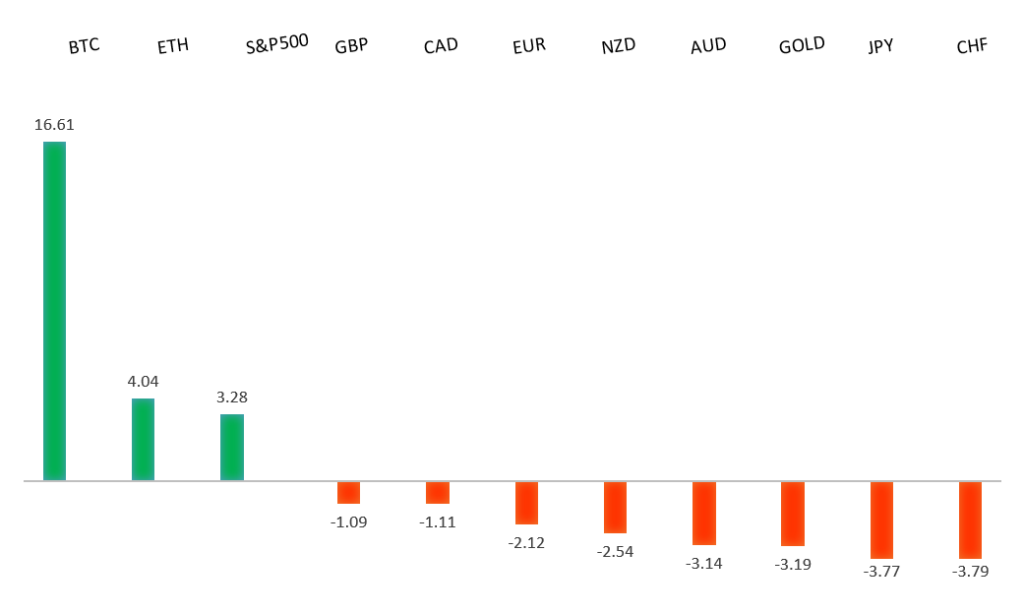
Peformance chart: 30-Day Performance vs. US dollar (%)
Suggested reading
- A Message from the Market We're Not Seeing?, J. Calhoun, Alhambra (February 12, 2024)
- The Trump Rally and Fed Bias, D. Westin, Bloomberg (February 12, 2024)
Chart talk: Technical & fundamental highlights
Choose pair:
EURUSD – technical overview
The Euro has been in a multi-month consolidation since bottoming out in 2022. Setbacks have since been exceptionally well supported on dips below 1.0500, with a higher platform sought out ahead of the next major upside extension. Look for a push through the 2023 high at 1.1276 to strengthen the constructive outlook and extend the recovery run towards 1.2000. Only back below 1.0400 negates.EURUSD – fundamental overview
The shift in monetary policy expectations over the past several days now has the ECB on pace to cut rates before the Fed. On the data front, German ZEW expectations rose modestly to 19.9 from 15.2 but the current situation sunk to a post-pandemic low -81.7. Key standouts on Wednesday’s calendar come from UK inflation, Eurozone employment, GDP, and industrial production, and US producer prices.EURUSD - Technical charts in detail
GBPUSD – technical overview
Signs have emerged of the market wanting to put in a longer-term base after collapsing to a record low in September 2022. The November 2022 monthly close back above 1.2000 strengthens this prospect. Any setbacks should now be well supported ahead of 1.2000. Next key resistance comes in at 1.2849.GBPUSD – fundamental overview
The Pound has held up relatively well on account of stronger UK jobs data that included a jump in earnings. The market has pushed back BOE rate cut expectations to August or September from what had been thoughts for a cut in May one month ago. Key standouts on Wednesday’s calendar come from UK inflation, Eurozone employment, GDP, and industrial production, and US producer prices.USDJPY – technical overview
The market remains confined to a strong uptrend, with sights set on a retest and break of the multi-year high from 2022 at 151.95. A push through this level will open the next major upside extension towards 155.00. Key support comes in at 145.90, with only a weekly close below to delay the constructive outlook.USDJPY – fundamental overview
The Yen is trying to recover after getting slammed in recent days, first on dovish BOJ speak, and then on hotter US inflation data. Perhaps comments from Japan's top FX official Kanda are helping to slow the Yen decline. Kanda was out on the wires saying recent Yen declines would be classified as rapid, and authorities are on the ready to take action if necessary. Key standouts on Wednesday’s calendar come from UK inflation, Eurozone employment, GDP, and industrial production, and US producer prices.AUDUSD – technical overview
There are signs of the potential formation of a longer-term base with the market trading down into a meaningful longer-term support zone. Only a monthly close below 0.6200 would give reason for rethink. Back above 0.6900 will take the big picture pressure off the downside and strengthen case for a bottom.AUDUSD – fundamental overview
The Australian Dollar couldn't avoid the downside pressure from a hotter US inflation print and accompanying weakness in US equities, with the currency sinking to a fresh yearly low. Key standouts on Wednesday’s calendar come from UK inflation, Eurozone employment, GDP, and industrial production, and US producer prices.USDCAD – technical overview
Above 1.3000 signals an end to a period of longer-term bearish consolidation and suggests the market is in the process of carving out a more significant longer-term base. Next key resistance now comes in up into the 1.4000 area. Setbacks should be very well supported down into the 1.3000 area.USDCAD – fundamental overview
The latest decline in the Canadian Dollar comes from the US inflation data reaction which had the market repricing Fed expectations and pushing back calls for rate cuts in 2024. The accompanying decline in US equities has only added to the Canadian Dollar outflow pressure. Key standouts on Wednesday’s calendar come from UK inflation, Eurozone employment, GDP, and industrial production, and US producer prices.NZDUSD – technical overview
Overall pressure remains on the downside with the market continuing to stall out on runs up into the 0.6500 area. At the same time, there are some signs of the market wanting to put in a longer-term base. Ultimately, a break back above 0.6500 would be required to take the medium-term pressure off the downside and encourage this prospect. A monthly close below 0.5800 will intensify bearish price action.NZDUSD – fundamental overview
There hasn't been much of a reaction to a round of second tier data out of New Zealand on Wednesday. Food prices rose, home sales fell, and credit card spending came out higher. Most of the attention has been on broader FX moves in the aftermath of the hot US inflation data. Key standouts on Wednesday’s calendar come from UK inflation, Eurozone employment, GDP, and industrial production, and US producer prices.US SPX 500 – technical overview
Longer-term technical studies continue to look quite extended after pushing to fresh record highs, begging for a deeper correction ahead. Look for rallies to be well capped in favor of lower tops and lower lows. A monthly close above 5000 will be required to delay the outlook. Next key support comes in at 4842.US SPX 500 – fundamental overview
The Fed has finally bent to the will of the market, with the December 2023 policy decision revealing rate projections coming down from previous and more in line with what the market has been looking for. This has translated to more investor friendly policy going forward, opening the door for a run to fresh record highs in early 2024. At the same time, with the inflation outlook still uncertain, the central bank not willing to fully play into market expectations for aggressive rate cuts, which could prove to be a disappointment for investors and start to weigh more heavily on stocks.GOLD (SPOT) – technical overview
The 2019 breakout above the 2016 high at 1375 was a significant development, opening the door for fresh record highs. Setbacks should now be well supported above 1900 on a monthly close basis ahead of the next major upside extension towards 2500.GOLD (SPOT) – fundamental overview
The yellow metal continues to be well supported on dips with solid demand from medium and longer-term accounts. These players are more concerned about inflation risk and a less stable and upbeat global growth outlook. All of this should keep the commodity well supported, with many market participants also fleeing to the hard asset as the grand dichotomy of record high equities and record low yields comes to an unnerving climax.