


Next 24 hours: Absence of data puts focus on Fed speak
Today’s report: A quiet start to the week
Things have gotten off to a quiet start as the week gets going, though we have seen some movement that’s worth highlighting. Looking at the calendar for the remainder of the day, the only thing that really stands out is central bank speak from various ECB and Fed officials.
Wake-up call
- impressive readings
- house prices
- capital spending
- discouraging data
- manufacturing PMIs
- Kiwi stumbles
- policy outlook
- Macro themes
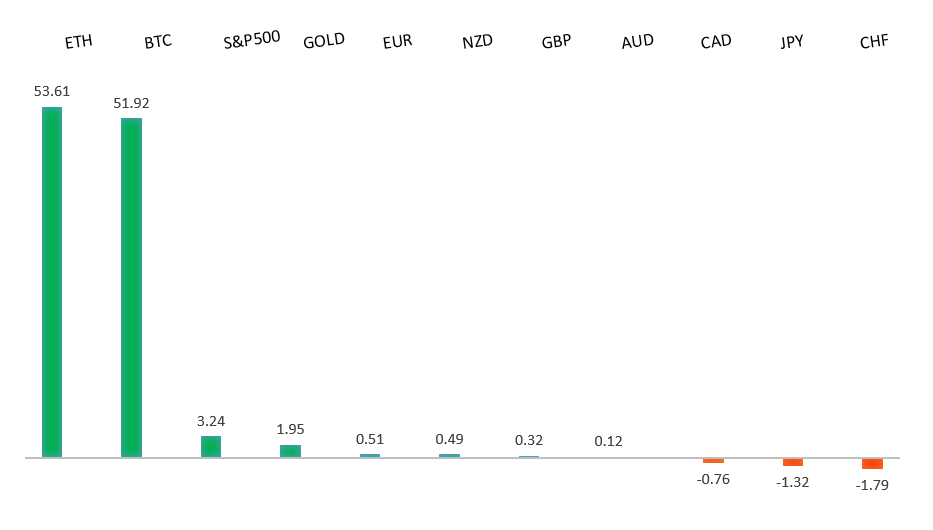
Peformance chart: 30-Day Performance vs. US dollar (%)
Suggested reading
- The Top Stock and ETF Picks by Ray Dalio, W. Duggan, Money (February 28, 2024)
- Thinking About When the Stock Market Will Sell Off, S. McBride, Risk Hedge (March 1, 2024)
Chart talk: Technical & fundamental highlights
Choose pair:
EURUSD – technical overview
The Euro has been in a multi-month consolidation since bottoming out in 2022. Setbacks have since been exceptionally well supported on dips below 1.0500, with a higher platform sought out ahead of the next major upside extension. Look for a push through the 2023 high at 1.1276 to strengthen the constructive outlook and extend the recovery run towards 1.2000. Only back below 1.0400 negates.EURUSD – fundamental overview
The Euro comes into the new week on the front foot after taking in Friday's upward revision to Eurozone manufacturing PMIs and a hotter than expected Eurozone core CPI read. Key standouts on Friday’s calendar come from German, Eurozone and UK manufacturing PMIs, Eurozone inflation, US ISM manufacturing, Michigan sentiment, construction spending, and Fed speak.EURUSD - Technical charts in detail
GBPUSD – technical overview
Signs have emerged of the market wanting to put in a longer-term base after collapsing to a record low in September 2022. The November 2022 monthly close back above 1.2000 strengthens this prospect. Any setbacks should now be well supported ahead of 1.2000. Next key resistance comes in at 1.2849.GBPUSD – fundamental overview
The Pound has been feeling better about the latest rise in UK Nationwide house prices, with the year over year rate turning positive for the first time in a year. Key standouts on Friday’s calendar come from German, Eurozone and UK manufacturing PMIs, Eurozone inflation, US ISM manufacturing, Michigan sentiment, construction spending, and Fed speak.USDJPY – technical overview
The market remains confined to a strong uptrend, with sights set on a retest and break of the multi-year high from 2022 at 151.95. A push through this level will open the next major upside extension towards 155.00. Key support comes in at 145.90, with only a weekly close below to delay the constructive outlook.USDJPY – fundamental overview
Earlier on, Japan Q4 capital spending came in well above forecast, also expanding at the quickest pace on record since the fourth quarter of 2006, reflecting an overall surge in optimism. Key standouts on Friday’s calendar come from German, Eurozone and UK manufacturing PMIs, Eurozone inflation, US ISM manufacturing, Michigan sentiment, construction spending, and Fed speak.AUDUSD – technical overview
There are signs of the potential formation of a longer-term base with the market trading down into a meaningful longer-term support zone. Only a monthly close below 0.6200 would give reason for rethink. Back above 0.6900 will take the big picture pressure off the downside and strengthen case for a bottom.AUDUSD – fundamental overview
The Australian Dollar is under pressure on Monday after taking in a round of discouraging Aussie data in the form of business inventories, job ads, and building approvals. Key standouts on Friday’s calendar come from German, Eurozone and UK manufacturing PMIs, Eurozone inflation, US ISM manufacturing, Michigan sentiment, construction spending, and Fed speak.USDCAD – technical overview
Above 1.3000 signals an end to a period of longer-term bearish consolidation and suggests the market is in the process of carving out a more significant longer-term base. Next key resistance now comes in up into the 1.4000 area. Setbacks should be very well supported down into the 1.3000 area.USDCAD – fundamental overview
The Canadian Dollar got a little boost on Friday from better than expected Canada manufacturing PMIs, higher oil, and record high US equities. Key standouts on Friday’s calendar come from German, Eurozone and UK manufacturing PMIs, Eurozone inflation, US ISM manufacturing, Michigan sentiment, construction spending, and Fed speak.NZDUSD – technical overview
Overall pressure remains on the downside with the market continuing to stall out on runs up into the 0.6500 area. At the same time, there are some signs of the market wanting to put in a longer-term base. Ultimately, a break back above 0.6500 would be required to take the medium-term pressure off the downside and encourage this prospect. A monthly close below 0.5800 will intensify bearish price action.NZDUSD – fundamental overview
The New Zealand Dollar is still struggling in the aftermath last week's dovish RBNZ communication, taking an added hit in the early week after New Zealand's Q4 terms of trade fell by more than expected. Key standouts on Friday’s calendar come from German, Eurozone and UK manufacturing PMIs, Eurozone inflation, US ISM manufacturing, Michigan sentiment, construction spending, and Fed speak.US SPX 500 – technical overview
Longer-term technical studies continue to look quite extended after pushing to fresh record highs, begging for a deeper correction ahead. Look for rallies to be well capped in favor of lower tops and lower lows. A monthly close above 5100 will be required to delay the outlook. Next key support comes in at 4842.US SPX 500 – fundamental overview
Though we have seen an adjustment of investor expectations towards the amount of rate cuts in 2024, the market still believes policy will end up erring more towards the investor friendly, accommodative side of things. This bet has kept stocks well bid and pushing record highs. Still, it's important to highlight the fact that the Fed has yet to declare a victory over inflation and could disappoint investors with less accommodative policy than desired going forward. If this happens, stocks could be in for a nasty bearish reversal.GOLD (SPOT) – technical overview
The 2019 breakout above the 2016 high at 1375 was a significant development, opening the door for fresh record highs. Setbacks should now be well supported above 1900 on a monthly close basis ahead of the next major upside extension towards 2500.GOLD (SPOT) – fundamental overview
The yellow metal continues to be well supported on dips with solid demand from medium and longer-term accounts. These players are more concerned about inflation risk and a less stable and upbeat global growth outlook. All of this should keep the commodity well supported, with many market participants also fleeing to the hard asset as the grand dichotomy of record high equities and record low yields comes to an end.