


Today’s report: Market celebrating Fed Chair testimony
We’re back to seeing broad based US Dollar outflows and record high US equities after a round of Fed Chair testimony in which Jerome Powell was celebrated by markets for embracing the rate cut outlook.
Wake-up call
- ECB
- Dollar outflows
- local wages
- China data
- Canada housing
- Sentiment uptick
- policy outlook
- Macro themes
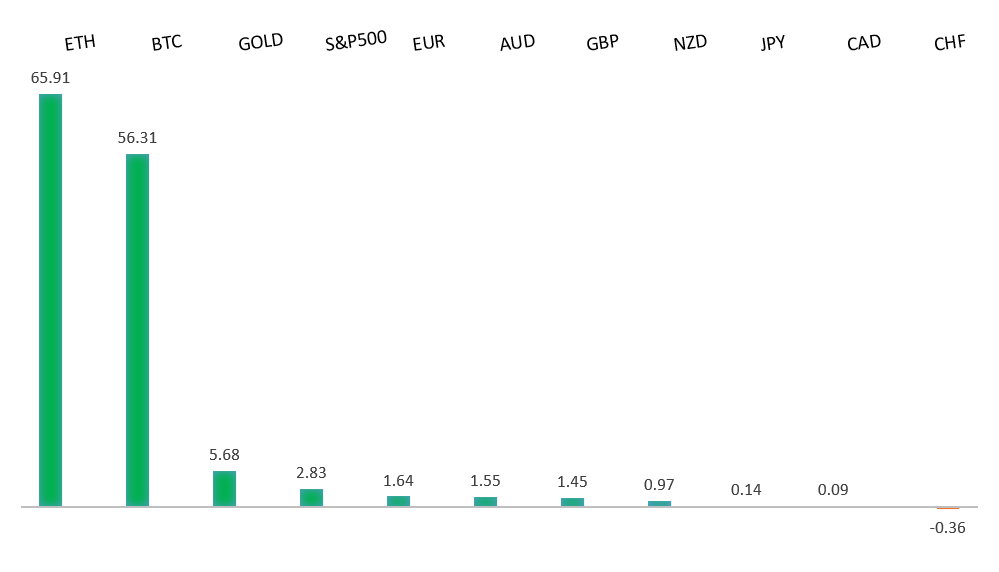
Peformance chart: 30-Day Performance vs. US dollar (%)
Suggested reading
- Don't Be "Sub-Optimal" In Your Approach To Investing, S. McBride, RiskHedge (March 1, 2024)
- Why Crypto Just Won’t Die, G. Edelman, The Atlantic (March 5, 2024)
Chart talk: Technical & fundamental highlights
Choose pair:
EURUSD – technical overview
The Euro has been in a multi-month consolidation since bottoming out in 2022. Setbacks have since been exceptionally well supported on dips below 1.0500, with a higher platform sought out ahead of the next major upside extension. Look for a push through the 2023 high at 1.1276 to strengthen the constructive outlook and extend the recovery run towards 1.2000. Only back below 1.0400 negates.EURUSD – fundamental overview
The Euro has popped higher after ECB President Lagarde ruled out the possibility of a rate cut until June. The ECB held policy as expected, sees inflation hitting the 2% target in 2025, but has been clear to say we aren't there yet. Key standouts on Friday’s calendar come from German industrial production, German producer prices, Eurozone employment, Eurozone GDP, Canada employment, and US employment.EURUSD - Technical charts in detail
GBPUSD – technical overview
Signs have emerged of the market wanting to put in a longer-term base after collapsing to a record low in September 2022. The November 2022 monthly close back above 1.2000 strengthens this prospect. Any setbacks should now be well supported ahead of 1.2000. Next key resistance comes in at 1.2849.GBPUSD – fundamental overview
Most of the upside in the Pound this week has been less about UK fundamentals and more about broad based US Dollar outflows as the market focuses on dovish Fed Chair testimony and higher equities. Key standouts on Friday’s calendar come from German industrial production, German producer prices, Eurozone employment, Eurozone GDP, Canada employment, and US employment.USDJPY – technical overview
The market remains confined to a strong uptrend, with sights set on a retest and break of the multi-year high from 2022 at 151.95. A push through this level will open the next major upside extension towards 155.00. Key support comes in at 145.90, with only a weekly close below to delay the constructive outlook.USDJPY – fundamental overview
The Yen has extended its run of gains on the back of surging local wage data, further supporting the narrative gaining momentum that the BOJ should be looking to exit negative interest rate policy. Key standouts on Friday’s calendar come from German industrial production, German producer prices, Eurozone employment, Eurozone GDP, Canada employment, and US employment.AUDUSD – technical overview
There are signs of the potential formation of a longer-term base with the market trading down into a meaningful longer-term support zone. Only a monthly close below 0.6200 would give reason for rethink. Back above 0.6900 will take the big picture pressure off the downside and strengthen case for a bottom.AUDUSD – fundamental overview
The Australian Dollar got an added boost on Thursday after responding to the stronger China import data. Key standouts on Friday’s calendar come from German industrial production, German producer prices, Eurozone employment, Eurozone GDP, Canada employment, and US employment.USDCAD – technical overview
Above 1.3000 signals an end to a period of longer-term bearish consolidation and suggests the market is in the process of carving out a more significant longer-term base. Next key resistance now comes in up into the 1.4000 area. Setbacks should be very well supported down into the 1.3000 area.USDCAD – fundamental overview
The Canadian Dollar has been rallying this week after the Bank of Canada leaned less dovish and Thursday's Canada data came in strong. Canada building permits and trade data came in much better than expected. Key standouts on Friday’s calendar come from German industrial production, German producer prices, Eurozone employment, Eurozone GDP, Canada employment, and US employment.NZDUSD – technical overview
Overall pressure remains on the downside with the market continuing to stall out on runs up into the 0.6500 area. At the same time, there are some signs of the market wanting to put in a longer-term base. Ultimately, a break back above 0.6500 would be required to take the medium-term pressure off the downside and encourage this prospect. A monthly close below 0.5800 will intensify bearish price action.NZDUSD – fundamental overview
Recent New Zealand manufacturing data came in less bad, while the New Zealand Dollar has also benefited from broad based US Dollar outflows and higher stocks. Key standouts on Friday’s calendar come from German industrial production, German producer prices, Eurozone employment, Eurozone GDP, Canada employment, and US employment.US SPX 500 – technical overview
Longer-term technical studies continue to look quite extended after pushing to fresh record highs, begging for a deeper correction ahead. Look for rallies to be well capped in favor of lower tops and lower lows. A monthly close above 5100 will be required to delay the outlook. Next key support comes in at 4842.US SPX 500 – fundamental overview
Though we have seen an adjustment of investor expectations towards the amount of rate cuts in 2024, the market still believes policy will end up erring more towards the investor friendly, accommodative side of things. This bet has kept stocks well bid and pushing record highs. Still, it's important to highlight the fact that the Fed has yet to declare a victory over inflation and could disappoint investors with less accommodative policy than desired going forward. If this happens, stocks could be in for a nasty bearish reversal.GOLD (SPOT) – technical overview
The 2019 breakout above the 2016 high at 1375 was a significant development, opening the door for fresh record highs. Setbacks should now be well supported above 1900 on a monthly close basis ahead of the next major upside extension towards 2500.GOLD (SPOT) – fundamental overview
The yellow metal continues to be well supported on dips with solid demand from medium and longer-term accounts. These players are more concerned about inflation risk and a less stable and upbeat global growth outlook. All of this should keep the commodity well supported, with many market participants also fleeing to the hard asset as the grand dichotomy of record high equities and record low yields comes to an end.