


Next 24 hours: Will the Fed make adjustments this week?
Today’s report: Lots of tension ahead of this week's Fed decision
Last week, we got a strong round of US economic data accompanied by hotter US inflation reads. The takeaway of course is that there might be a lot more pressure on the Fed to be looking to scale back its rate cut outlook at this week’s meeting.
Wake-up call
- USD demand
- inflation expectations
- Jiji report
- China data
- Canada housing
- PSI reading
- policy outlook
- Macro themes
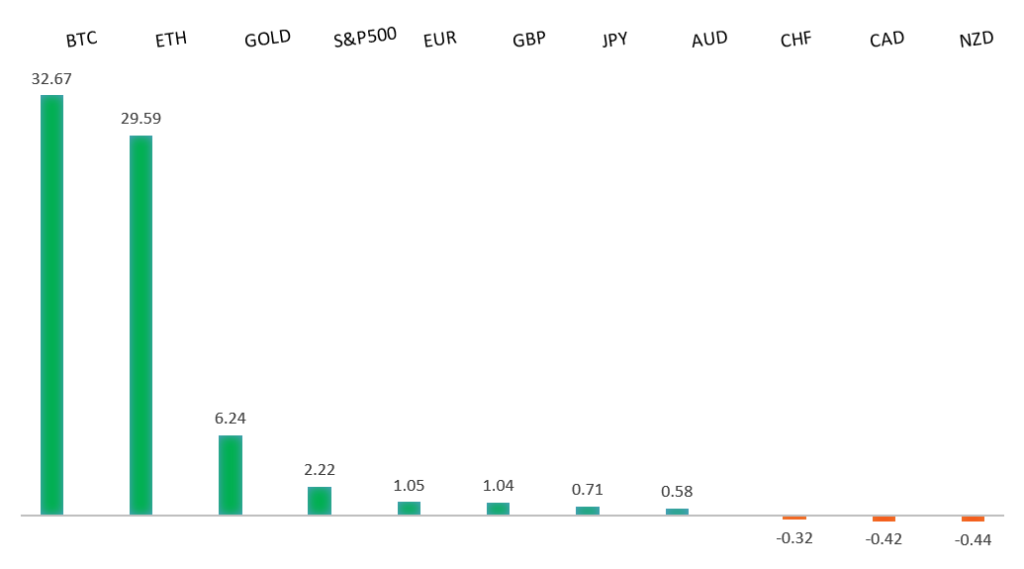
Peformance chart: 30-Day Performance vs. US dollar (%)
Suggested reading
- How Does Inflation Protect Your Retirement Plan?, M. Backman, The Motley Fool (March 14, 2024)
- How We Got Here and Where We’re Going, D. Bahnsen, National Review (March 14, 2024)
Chart talk: Technical & fundamental highlights
Choose pair:
EURUSD – technical overview
The Euro has been in a multi-month consolidation since bottoming out in 2022. Setbacks have since been exceptionally well supported on dips below 1.0500, with a higher platform sought out ahead of the next major upside extension. Look for a push through the 2023 high at 1.1276 to strengthen the constructive outlook and extend the recovery run towards 1.2000. Only back below 1.0400 negates.EURUSD – fundamental overview
The Euro comes into the new week contending with a wave of US Dollar bullishness on the back of strong US data and hotter US inflation data. The big focus for the week ahead will be on the Fed meeting and whether or not the central bank makes adjustments based on the recent data and scales back the rate cut forecast. Key standouts on Monday’s calendar come from Eurozone trade, Eurozone CPI, and Canada producer prices.EURUSD - Technical charts in detail
GBPUSD – technical overview
Signs have emerged of the market wanting to put in a longer-term base after collapsing to a record low in September 2022. The latest push to a fresh 2024 high beyond 1.2830 confirms the outlook and opens the door for the next major upside extension towards the 2023 high at 1.3143. Any setbacks should now be well supported ahead of 1.2500.GBPUSD – fundamental overview
The Pound was sold into the end of last week after a quarterly BOE poll showed year ahead inflation expectations down to 3% from 3.3% previous, the lowest since August 2021. Meanwhile, broad based US Dollar demand on strong US data also weighed on the Pound. Key standouts on Monday’s calendar come from Eurozone trade, Eurozone CPI, and Canada producer prices.USDJPY – technical overview
The market remains confined to a strong uptrend, with sights set on a retest and break of the multi-year high from 2022 at 151.95. A push through this level will open the next major upside extension towards 155.00. Key support comes in at 145.90, with only a weekly close below to delay the constructive outlook.USDJPY – fundamental overview
Last week's Jiji news report that the BOJ is arranging to end its negative interest rate policy at this week's meeting has fallen on deaf ears, with the market tired of hearing things that never actually end up playing. Instead, it's back to selling Yen and buying US Dollars on the back of the latest wave of strong US data and hot inflation reads. Key standouts on Monday’s calendar come from Eurozone trade, Eurozone CPI, and Canada producer prices.AUDUSD – technical overview
There are signs of the potential formation of a longer-term base with the market trading down into a meaningful longer-term support zone. Only a monthly close below 0.6200 would give reason for rethink. Back above 0.6900 will take the big picture pressure off the downside and strengthen case for a bottom.AUDUSD – fundamental overview
The Australian Dollar is getting a little boost from the slightly better than expected Chinese retail sales data. The focus now turns to tomorrow's RBA decision, with the market pricing a rate hold but leaning more towards the side of expecting a more dovish leaning central bank. Key standouts on Monday’s calendar come from Eurozone trade, Eurozone CPI, and Canada producer prices.USDCAD – technical overview
Above 1.3000 signals an end to a period of longer-term bearish consolidation and suggests the market is in the process of carving out a more significant longer-term base. Next key resistance now comes in up into the 1.4000 area. Setbacks should be very well supported down into the 1.3000 area.USDCAD – fundamental overview
Strong Canada housing starts and surging oil helped to offset some of the Canadian Dollar weakness from impressive US data and hotter US inflation reads. Key standouts on Monday’s calendar come from Eurozone trade, Eurozone CPI, and Canada producer prices.NZDUSD – technical overview
Overall pressure remains on the downside with the market continuing to stall out on runs up into the 0.6500 area. At the same time, there are some signs of the market wanting to put in a longer-term base. Ultimately, a break back above 0.6500 would be required to take the medium-term pressure off the downside and encourage this prospect. A monthly close below 0.5800 will intensify bearish price action.NZDUSD – fundamental overview
We're seeing some demand for the New Zealand Dollar as the week gets going on the back of upbeat New Zealand business PSI data and slightly better than forecast China retail sales. Key standouts on Monday’s calendar come from Eurozone trade, Eurozone CPI, and Canada producer prices.US SPX 500 – technical overview
Longer-term technical studies continue to look quite extended after pushing to fresh record highs, begging for a deeper correction ahead. Look for rallies to be well capped in favor of lower tops and lower lows. A monthly close above 5100 will be required to delay the outlook. Next key support comes in at 4842.US SPX 500 – fundamental overview
Though we have seen an adjustment of investor expectations towards the amount of rate cuts in 2024, the market still believes policy will end up erring more towards the investor friendly, accommodative side of things. This bet has kept stocks well bid and pushing record highs. Still, it's important to highlight the fact that the Fed has yet to declare a victory over inflation and could disappoint investors with less accommodative policy than desired going forward. If this happens, stocks could be in for a nasty bearish reversal.GOLD (SPOT) – technical overview
The 2019 breakout above the 2016 high at 1375 was a significant development, opening the door for fresh record highs. Setbacks should now be well supported above 1900 on a monthly close basis ahead of the next major upside extension towards 2500.GOLD (SPOT) – fundamental overview
The yellow metal continues to be well supported on dips with solid demand from medium and longer-term accounts. These players are more concerned about inflation risk and a less stable and upbeat global growth outlook. All of this should keep the commodity well supported, with many market participants also fleeing to the hard asset as the grand dichotomy of record high equities and record low yields comes to an end.