


Next 24 hours: A clear wave of risk off flow
Today’s report: BOJ and RBA decisions trigger Yen and Aussie selling
Already on Tuesday we’ve had two central bank decisions, both of which inspiring dovish reactions. Looking ahead, key standouts on the calendar for the remainder of the day come from Eurozone and German ZEW reads, Canada inflation, and US housing starts and building permits.
Wake-up call
- ZEW reads
- house prices
- BOJ emphasizes
- dovish skew
- inflation data
- in sympathy
- policy outlook
- Macro themes
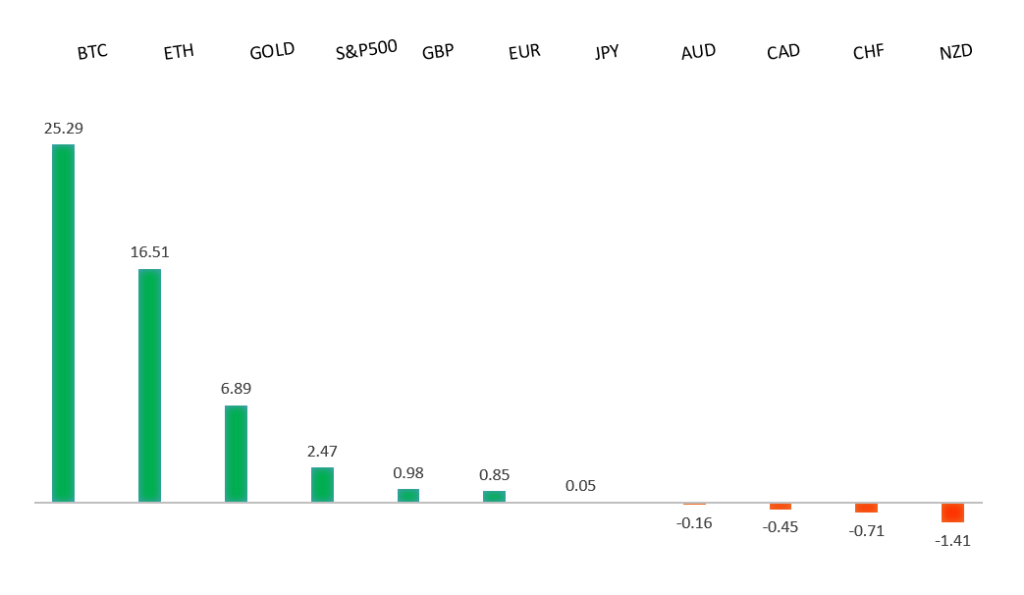
Peformance chart: 30-Day Performance vs. US dollar (%)
Suggested reading
- So Much Money Everywhere, B. Carlson, A Wealth of Common Sense (March 17, 2024)
- AI Stocks: Growing Your Wealth In a Dot-Com Boom 2.0, L. Lango, Investor Place (March 16, 2024)
Chart talk: Technical & fundamental highlights
Choose pair:
EURUSD – technical overview
The Euro has been in a multi-month consolidation since bottoming out in 2022. Setbacks have since been exceptionally well supported on dips below 1.0500, with a higher platform sought out ahead of the next major upside extension. Look for a push through the 2023 high at 1.1276 to strengthen the constructive outlook and extend the recovery run towards 1.2000. Only back below 1.0400 negates.EURUSD – fundamental overview
On Monday, Eurozone inflation data came in as expected. The biggest takeaway from the Euro side was a round of dovish ECB speak, with both De Cos and Centeno talking rate cuts. Looking ahead, key standouts on the calendar for the remainder of the day come from Eurozone and German ZEW reads, Canada inflation, and US housing starts and building permits.EURUSD - Technical charts in detail
GBPUSD – technical overview
Signs have emerged of the market wanting to put in a longer-term base after collapsing to a record low in September 2022. The latest push to a fresh 2024 high beyond 1.2830 confirms the outlook and opens the door for the next major upside extension towards the 2023 high at 1.3143. Any setbacks should now be well supported ahead of 1.2500.GBPUSD – fundamental overview
UK housing data came in on the better side of expectation, though the Pound was under mild pressure on account of strong US data pointing to a potential adjustment of Fed policy this week. UK Rightmove house prices rose the fastest in ten months. Looking ahead, key standouts on the calendar for the remainder of the day come from Eurozone and German ZEW reads, Canada inflation, and US housing starts and building permits.USDJPY – technical overview
The market remains confined to a strong uptrend, with sights set on a retest and break of the multi-year high from 2022 at 151.95. A push through this level will open the next major upside extension towards 155.00. Key support comes in at 145.90, with only a weekly close below to delay the constructive outlook.USDJPY – fundamental overview
Earlier today, the BOJ announced its decision to end negative interest rate policy and YCC. However, the emphasis from the central bank that this did not signal the start to a robust tightening cycle was enough to once again get the market selling the Yen aggressively. Looking ahead, key standouts on the calendar for the remainder of the day come from Eurozone and German ZEW reads, Canada inflation, and US housing starts and building permits.AUDUSD – technical overview
There are signs of the potential formation of a longer-term base with the market trading down into a meaningful longer-term support zone. Only a monthly close below 0.6200 would give reason for rethink. Back above 0.6900 will take the big picture pressure off the downside and strengthen case for a bottom.AUDUSD – fundamental overview
Earlier today, the RBA left rates unchanged as widely expected. However, the lack of clarity with respect to the next rate move and talk of the outlook being balanced was enough to scare away Aussie bulls, opening this latest round of setbacks. Looking ahead, key standouts on the calendar for the remainder of the day come from Eurozone and German ZEW reads, Canada inflation, and US housing starts and building permits.USDCAD – technical overview
Above 1.3000 signals an end to a period of longer-term bearish consolidation and suggests the market is in the process of carving out a more significant longer-term base. Next key resistance now comes in up into the 1.4000 area. Setbacks should be very well supported down into the 1.3000 area.USDCAD – fundamental overview
It was a mixed bag of data out of Canada on Monday, with industrial product prices rising but existing home sales declining. Higher oil did help the Canadian Dollar's cause a bit, though most of the price action was around buying US Dollars ahead of the Fed decision. Looking ahead, key standouts on the calendar for the remainder of the day come from Eurozone and German ZEW reads, Canada inflation, and US housing starts and building permits.NZDUSD – technical overview
Overall pressure remains on the downside with the market continuing to stall out on runs up into the 0.6500 area. At the same time, there are some signs of the market wanting to put in a longer-term base. Ultimately, a break back above 0.6500 would be required to take the medium-term pressure off the downside and encourage this prospect. A monthly close below 0.5800 will intensify bearish price action.NZDUSD – fundamental overview
The New Zealand Dollar has come under some pressure on Tuesday in sympathy with its Aussie cousin in the aftermath of the more dovish leaning RBA decision. Looking ahead, key standouts on the calendar for the remainder of the day come from Eurozone and German ZEW reads, Canada inflation, and US housing starts and building permits.US SPX 500 – technical overview
Longer-term technical studies continue to look quite extended after pushing to fresh record highs, begging for a deeper correction ahead. Look for rallies to be well capped in favor of lower tops and lower lows. A monthly close above 5100 will be required to delay the outlook. Next key support comes in at 4842.US SPX 500 – fundamental overview
Though we have seen an adjustment of investor expectations towards the amount of rate cuts in 2024, the market still believes policy will end up erring more towards the investor friendly, accommodative side of things. This bet has kept stocks well bid and pushing record highs. Still, it's important to highlight the fact that the Fed has yet to declare a victory over inflation and could disappoint investors with less accommodative policy than desired going forward. If this happens, stocks could be in for a nasty bearish reversal.GOLD (SPOT) – technical overview
The 2019 breakout above the 2016 high at 1375 was a significant development, opening the door for fresh record highs. Setbacks should now be well supported above 1900 on a monthly close basis ahead of the next major upside extension towards 2500.GOLD (SPOT) – fundamental overview
The yellow metal continues to be well supported on dips with solid demand from medium and longer-term accounts. These players are more concerned about inflation risk and a less stable and upbeat global growth outlook. All of this should keep the commodity well supported, with many market participants also fleeing to the hard asset as the grand dichotomy of record high equities and record low yields comes to an end.