


Today’s report: Reconciling the disconnect between the Dollar and stocks
As we come into the end of the week, the US Dollar is finding its way back, all while US equities track at record highs. More often than not, a rallying Dollar and soaring equities don’t go hand in hand. And yet, this is what we’ve been seeing. So how can the price action be reconciled?
Wake-up call
- soft PMIs
- Hawkish views
- BOJ's resolve
- USD demand
- retail sales
- trade data
- policy outlook
- Macro themes
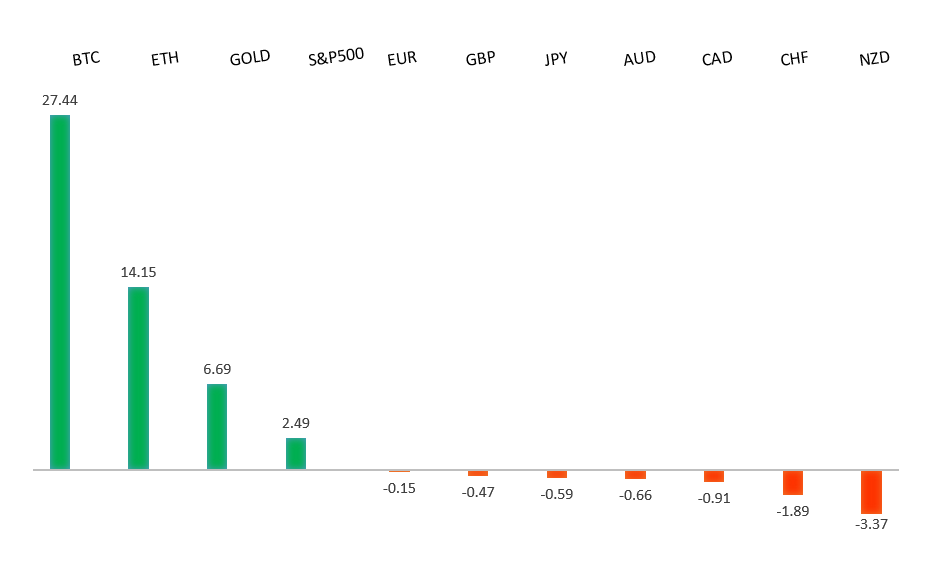
Peformance chart: 30-Day Performance vs. US dollar (%)
Suggested reading
- Why We Think 5 Interest-Rate Cuts Are Coming This Year, P. Caldwell, Morningstar (March 21, 2024)
- Fear Of Missing Out On Another Tech Boom, N. Bilton, Vanity Fair (March 20, 2024)
Chart talk: Technical & fundamental highlights
Choose pair:
EURUSD – technical overview
The Euro has been in a multi-month consolidation since bottoming out in 2022. Setbacks have since been exceptionally well supported on dips below 1.0500, with a higher platform sought out ahead of the next major upside extension. Look for a push through the 2023 high at 1.1276 to strengthen the constructive outlook and extend the recovery run towards 1.2000. Only back below 1.0400 negates.EURUSD – fundamental overview
A discouraging round of Eurozone PMI data and a market waking up to the fact that the Fed is sounding the least dovish of all of the major central banks, is what has been driving a lot of the latest round of setbacks in the single currency. Key standouts on Friday’s calendar comes from UK retail sales, German Ifo reads, and Canada retail sales.EURUSD - Technical charts in detail
GBPUSD – technical overview
Signs have emerged of the market wanting to put in a longer-term base after collapsing to a record low in September 2022. The latest push to a fresh 2024 high beyond 1.2830 confirms the outlook and opens the door for the next major upside extension towards the 2023 high at 1.3143. Any setbacks should now be well supported ahead of 1.2500.GBPUSD – fundamental overview
The market was caught off guard with the more dovish leaning Bank of England decision and the Pound has since suffered in the aftermath. There was a vote for a rate cut, while there were also no hawks left voting for rate hikes. Key standouts on Friday’s calendar comes from UK retail sales, German Ifo reads, and Canada retail sales.USDJPY – technical overview
The market remains confined to a strong uptrend, with sights set on a retest and break of the multi-year high from 2022 at 151.95. A push through this level will open the next major upside extension towards 155.00. Key support comes in at 146.48, with only a weekly close below to delay the constructive outlook.USDJPY – fundamental overview
Traders are intent on testing the BOJ's resolve, as the Yen continues to slide back towards the multi-year low in the aftermath of a central bank decision which ultimately showed the BOJ sticking to a commitment of easy policy despite the removal of NIRP. Hotter Japan inflation data has also done nothing to sway traders much from wanting to continue to sell the Yen. Key standouts on Friday’s calendar comes from UK retail sales, German Ifo reads, and Canada retail sales.AUDUSD – technical overview
There are signs of the potential formation of a longer-term base with the market trading down into a meaningful longer-term support zone. Only a monthly close below 0.6200 would give reason for rethink. Back above 0.6900 will take the big picture pressure off the downside and strengthen case for a bottom.AUDUSD – fundamental overview
The Australian Dollar has come back under pressure into the end of the week as market participants wake up to the fact that despite the Fed decision being a relief to the market, the Fed is ultimately still looking a lot less dovish than the other major central banks. Yesterday's round of stronger US economic data only strengthens this case. Key standouts on Friday’s calendar comes from UK retail sales, German Ifo reads, and Canada retail sales.USDCAD – technical overview
Above 1.3000 signals an end to a period of longer-term bearish consolidation and suggests the market is in the process of carving out a more significant longer-term base. Next key resistance now comes in up into the 1.4000 area. Setbacks should be very well supported down into the 1.3000 area.USDCAD – fundamental overview
The Canadian Dollar is under pressure into the end of the week as the US Dollar comes back in demand on strong economic data. Meanwhile, setbacks in the price of oil are also contributing to the flow. Key standouts on Friday’s calendar comes from UK retail sales, German Ifo reads, and Canada retail sales.NZDUSD – technical overview
Overall pressure remains on the downside with the market continuing to stall out on runs up into the 0.6500 area. At the same time, there are some signs of the market wanting to put in a longer-term base. Ultimately, a break back above 0.6500 would be required to take the medium-term pressure off the downside and encourage this prospect. A monthly close below 0.5800 will intensify bearish price action.NZDUSD – fundamental overview
The New Zealand Dollar is trading at yearly lows as it contends with this week's discouraging Kiwi data in the form of GDP and trade, and with a Federal Reserve that is sounding a lot less dovish than all of the other central banks. Key standouts on Friday’s calendar comes from UK retail sales, German Ifo reads, and Canada retail sales.US SPX 500 – technical overview
Longer-term technical studies continue to look quite extended after pushing to fresh record highs, begging for a deeper correction ahead. Look for rallies to be well capped in favor of lower tops and lower lows. Next key support comes in at 5110.US SPX 500 – fundamental overview
Though we have seen an adjustment of investor expectations towards the amount of rate cuts in 2024, the market still believes policy will end up erring more towards the investor friendly, accommodative side of things. This bet has kept stocks well bid and pushing record highs. Still, it's important to highlight the fact that the Fed has yet to declare a victory over inflation and could disappoint investors with less accommodative policy than desired going forward. If this happens, stocks could be in for a nasty bearish reversal.GOLD (SPOT) – technical overview
The 2019 breakout above the 2016 high at 1375 was a significant development, opening the door for fresh record highs. Setbacks should now be well supported above 1900 on a monthly close basis ahead of the next major upside extension towards 2500.GOLD (SPOT) – fundamental overview
The yellow metal continues to be well supported on dips with solid demand from medium and longer-term accounts. These players are more concerned about inflation risk and a less stable and upbeat global growth outlook. All of this should keep the commodity well supported, with many market participants also fleeing to the hard asset as the grand dichotomy of record high equities and record low yields comes to an end.