


Today’s report: Thinner trading conditions expected on Good Friday
Trading conditions on this Friday will be thinner on account of many market participants being off the desks for the Good Friday holiday. Key standouts on Friday’s calendar come from US core PCE, personal income, personal spending, the goods trade balance, wholesale inventories, and a Fed Powell speech.
Wake-up call
- dovish speak
- technical recession
- inflation data
- US economy
- GDP, oil
- Dovish RBNZ
- easy policy
- Macro themes
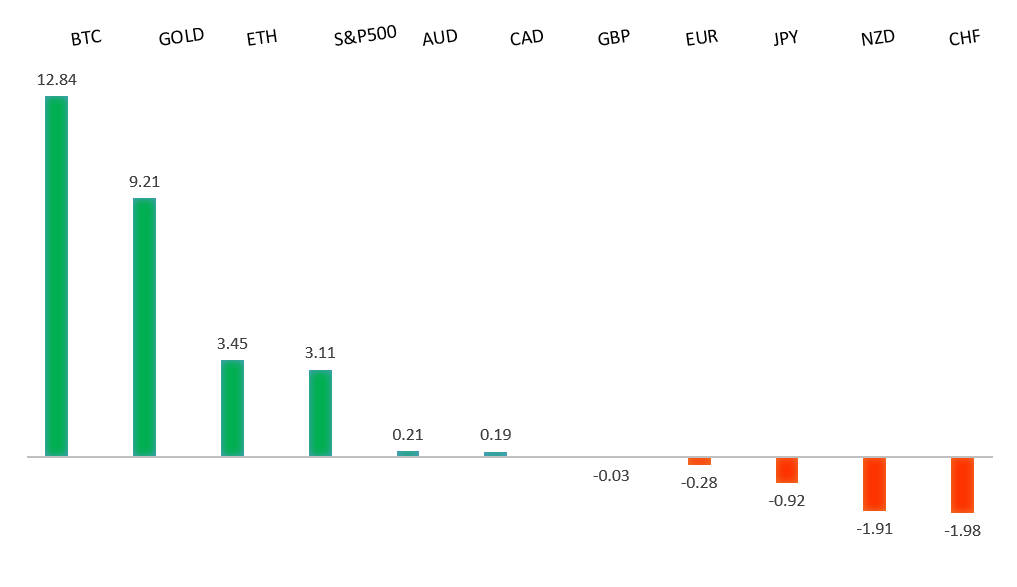
Peformance chart: 30-Day Performance vs. US dollar (%)
Suggested reading
- Sketchy Politics: Can Anything Save Sunak?, R. Shrimsley, FT (March 28, 2024)
- 2024 Annual Chairman’s Letter to Investors, L. Fink, BlackRock (March 28, 2024)
Chart talk: Technical & fundamental highlights
Choose pair:
EURUSD – technical overview
The Euro has been in a multi-month consolidation since bottoming out in 2022. Setbacks have since been exceptionally well supported on dips below 1.0500, with a higher platform sought out ahead of the next major upside extension. Look for a push through the 2023 high at 1.1276 to strengthen the constructive outlook and extend the recovery run towards 1.2000. Only back below 1.0400 negates.EURUSD – fundamental overview
The latest slide in the Euro comes from another round of dovish ECB comments and soft economic data. ECB Panetta was out talking about a rapid inflation decline and the central bank getting closer to cutting rates. Meanwhile, German retail sales came in much softer than expected on Thursday. Key standouts on Friday’s calendar come from US core PCE, personal income, personal spending, the goods trade balance, wholesale inventories, and a Fed Powell speech.EURUSD - Technical charts in detail
GBPUSD – technical overview
Signs have emerged of the market wanting to put in a longer-term base after collapsing to a record low in September 2022. The latest push to a fresh 2024 high beyond 1.2830 confirms the outlook and opens the door for the next major upside extension towards the 2023 high at 1.3143. Any setbacks should now be well supported ahead of 1.2500.GBPUSD – fundamental overview
UK markets aren't expected to move all that much on account of the Good Friday holiday. However, there has been some clear downside pressure on the Pound into the end of the week after UK Q4 GDP data produced a negative print, confirming a technical recession. Key standouts on Friday’s calendar come from US core PCE, personal income, personal spending, the goods trade balance, wholesale inventories, and a Fed Powell speech.USDJPY – technical overview
The market remains confined to a strong uptrend, with sights set on a retest and break of the multi-year high from 2022 at 151.95. A push through this level will open the next major upside extension towards 155.00. Key support comes in at 146.48, with only a weekly close below to delay the constructive outlook.USDJPY – fundamental overview
Friday's round of higher than expected Tokyo inflation data comes as a relief to Japanese authorities, who have been fighting vigorously against the prospect for additional Yen weakness. The Yen is tracking at multi-year lows and it looks as though a line in the sand has been drawn, at least for now at USDJPY 152.00. This follows the emergency meeting earlier in the week between the BOJ, MOF, and FSA. Ultimately however, it's very hard to fight against natural flow in a currency and intervention efforts don't usually succeed over time. Key standouts on Friday’s calendar come from US core PCE, personal income, personal spending, the goods trade balance, wholesale inventories, and a Fed Powell speech.AUDUSD – technical overview
There are signs of the potential formation of a longer-term base with the market trading down into a meaningful longer-term support zone. Only a monthly close below 0.6200 would give reason for rethink. Back above 0.6900 will take the big picture pressure off the downside and strengthen case for a bottom.AUDUSD – fundamental overview
The Australian Dollar hasn't been able to get much boost from a lackluster China economy, while ongoing stronger data out of the US continues to push yield differentials back in the Buck's favor. Key standouts on Friday’s calendar come from US core PCE, personal income, personal spending, the goods trade balance, wholesale inventories, and a Fed Powell speech.USDCAD – technical overview
Above 1.3000 signals an end to a period of longer-term bearish consolidation and suggests the market is in the process of carving out a more significant longer-term base. Next key resistance now comes in up into the 1.4000 area. Setbacks should be very well supported down into the 1.3000 area.USDCAD – fundamental overview
The Canadian Dollar managed to defy the trend of currencies getting sold against the US Dollar. On Thursday, Canada GDP came in a good deal better than expected, while at the same time, the price of oil traded back towards multi-week highs. Key standouts on Friday’s calendar come from US core PCE, personal income, personal spending, the goods trade balance, wholesale inventories, and a Fed Powell speech.NZDUSD – technical overview
Overall pressure remains on the downside with the market continuing to stall out on runs up into the 0.6500 area. At the same time, there are some signs of the market wanting to put in a longer-term base. Ultimately, a break back above 0.6500 would be required to take the medium-term pressure off the downside and encourage this prospect. A monthly close below 0.5800 will intensify bearish price action.NZDUSD – fundamental overview
The New Zealand Dollar is trading at yearly lows as it contends with a slower economy and dovish rhetoric out from RBNZ Orr. The central bank Governor recently said he saw signs for 'more normalized' rates on the horizon, suggesting that if economic conditions worsen in New Zealand, the RBNZ would have no qualms about cutting rates. All has otherwise been quiet on the Good Friday trade. Key standouts on Friday’s calendar come from US core PCE, personal income, personal spending, the goods trade balance, wholesale inventories, and a Fed Powell speech.US SPX 500 – technical overview
Longer-term technical studies continue to look quite extended after pushing to fresh record highs, begging for a deeper correction ahead. Look for rallies to be well capped in favor of lower tops and lower lows. Next key support comes in at 5110.US SPX 500 – fundamental overview
Though we have seen an adjustment of investor expectations towards the amount of rate cuts in 2024, the market still believes policy will end up erring more towards the investor friendly, accommodative side of things. This bet has kept stocks well bid and pushing record highs. Still, it's important to highlight the fact that the Fed has yet to declare a victory over inflation and could disappoint investors with less accommodative policy than desired going forward. If this happens, stocks could be in for a nasty bearish reversal.GOLD (SPOT) – technical overview
The 2019 breakout above the 2016 high at 1375 was a significant development, opening the door for fresh record highs. Setbacks should now be well supported above 1900 on a monthly close basis ahead of the next major upside extension towards 2500.GOLD (SPOT) – fundamental overview
The yellow metal continues to be well supported on dips with solid demand from medium and longer-term accounts. These players are more concerned about inflation risk and a less upbeat global growth outlook. All of this should keep the commodity well supported, with many market participants also fleeing to the hard asset as the grand dichotomy of record high equities and record low yields comes to an end.