


Next 24 hours: Currencies recover, US equity futures head south
Today’s report: Are US equities at risk for bearish reversal?
US economic data continues to come in on the stronger side and market rate odds for a June cut at the Fed have dipped below 60%, which is the lowest June odds print for the year. The currency market has responded as one would expect, with the US Dollar well in demand across the board.
Wake-up call
- EURUSD Nervous talk from ECB officials
- manufacturing PMI
- Tankan data
- RBA Minutes
- outperforms peers
- Dovish RBNZ
- easy policy
- Macro themes
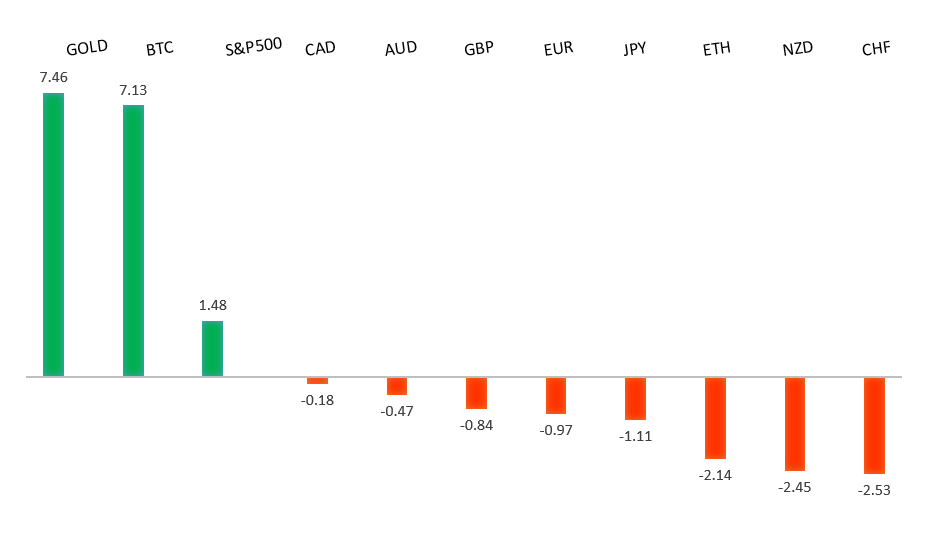
Peformance chart: 30-Day Performance vs. US dollar (%)
Suggested reading
- We Need to Talk About Brexit, D. Garrahan, Financial Times (April 2, 2024)
- Inflation? Commodities Are In Rally Mode, JC. Parets, All Star Charts (March 30, 2024)
Chart talk: Technical & fundamental highlights
Choose pair:
EURUSD – technical overview
The Euro has been in a multi-month consolidation since bottoming out in 2022. Setbacks have since been exceptionally well supported on dips below 1.0500, with a higher platform sought out ahead of the next major upside extension. Look for a push through the 2023 high at 1.1276 to strengthen the constructive outlook and extend the recovery run towards 1.2000. Only back below 1.0400 negates.EURUSD – fundamental overview
There's been a lot more nervous talk out from ECB officials worrying about the risks associated with cutting rates too late. ECB Villeroy is the latest central banker to express this sentiment, which has unquestionably added to Euro downside pressure in recent sessions. Key standouts on Tuesday’s calendar come from German, Eurozone, and UK manufacturing PMI reads, German inflation, US JOLTs job openings, US factory orders, and some Fed speak.EURUSD - Technical charts in detail
GBPUSD – technical overview
Signs have emerged of the market wanting to put in a longer-term base after collapsing to a record low in September 2022. The latest push to a fresh 2024 high beyond 1.2830 confirms the outlook and opens the door for the next major upside extension towards the 2023 high at 1.3143. Any setbacks should now be well supported ahead of 1.2500.GBPUSD – fundamental overview
The Easter holiday hasn't done anything to stop the Pound from coming under intense pressure in recent sessions. The UK currency is still struggling with last week's discouraging GDP data that put the UK economy into a technical recession. Key standouts on Tuesday’s calendar come from German, Eurozone, and UK manufacturing PMI reads, German inflation, US JOLTs job openings, US factory orders, and some Fed speak.USDJPY – technical overview
The market remains confined to a strong uptrend, with sights set on a retest and break of the multi-year high from 2022 at 151.95. A push through this level will open the next major upside extension towards 155.00. Key support comes in at 146.48, with only a weekly close below to delay the constructive outlook.USDJPY – fundamental overview
On Monday, Japan Tankan data came out mostly positive, however, this did nothing to stop the Yen from wanting to continue to trade to fresh multi-year lows against the US Dollar. Yield differentials have been too difficult to ignore, despite efforts on behalf of Japanese officials to warn against additional unwanted weakness in the Yen. Key standouts on Tuesday’s calendar come from German, Eurozone, and UK manufacturing PMI reads, German inflation, US JOLTs job openings, US factory orders, and some Fed speak.AUDUSD – technical overview
There are signs of the potential formation of a longer-term base with the market trading down into a meaningful longer-term support zone. Only a monthly close below 0.6200 would give reason for rethink. Back above 0.6900 will take the big picture pressure off the downside and strengthen case for a bottom.AUDUSD – fundamental overview
The RBA Minutes showed there was no consideration for a rate hike, though this didn't come as much of a surprise to the market. Tuesday economic data out of Australian has been offsetting for the Australian Dollar. On the one side, manufacturing PMI data was unimpressive. On the other side, inflation reads came in hot. Key standouts on Tuesday’s calendar come from German, Eurozone, and UK manufacturing PMI reads, German inflation, US JOLTs job openings, US factory orders, and some Fed speak.USDCAD – technical overview
Above 1.3000 signals an end to a period of longer-term bearish consolidation and suggests the market is in the process of carving out a more significant longer-term base. Next key resistance now comes in up into the 1.4000 area. Setbacks should be very well supported down into the 1.3000 area.USDCAD – fundamental overview
The Canadian Dollar hasn't been able to avoid trading lower against the Buck, but has outperformed its peers on account of solid Canada manufacturing PMIs, an upbeat Bank of Canada business outlook survey, and a rallying oil price. Key standouts on Tuesday’s calendar come from German, Eurozone, and UK manufacturing PMI reads, German inflation, US JOLTs job openings, US factory orders, and some Fed speak.NZDUSD – technical overview
Overall pressure remains on the downside with the market continuing to stall out on runs up into the 0.6500 area. At the same time, there are some signs of the market wanting to put in a longer-term base. Ultimately, a break back above 0.6500 would be required to take the medium-term pressure off the downside and encourage this prospect. A monthly close below 0.5800 will intensify bearish price action.NZDUSD – fundamental overview
The New Zealand Dollar is trading at yearly lows as it contends with a slower economy and dovish rhetoric out from RBNZ Orr. The central bank Governor recently said he saw signs for 'more normalized' rates on the horizon, suggesting that if economic conditions worsen in New Zealand, the RBNZ would have no qualms about cutting rates. Key standouts on Tuesday’s calendar come from German, Eurozone, and UK manufacturing PMI reads, German inflation, US JOLTs job openings, US factory orders, and some Fed speak.US SPX 500 – technical overview
Longer-term technical studies continue to look quite extended after pushing to fresh record highs, begging for a deeper correction ahead. Look for rallies to be well capped in favor of lower tops and lower lows. Next key support comes in at 5110.US SPX 500 – fundamental overview
Though we have seen an adjustment of investor expectations towards the amount of rate cuts in 2024, the market still believes policy will end up erring more towards the investor friendly, accommodative side of things. This bet has kept stocks well bid and pushing record highs. Still, it's important to highlight the fact that the Fed has yet to declare a victory over inflation and could disappoint investors with less accommodative policy than desired going forward. If this happens, stocks could be in for a nasty bearish reversal.GOLD (SPOT) – technical overview
The 2019 breakout above the 2016 high at 1375 was a significant development, opening the door for fresh record highs. Setbacks should now be well supported above 1900 on a monthly close basis ahead of the next major upside extension towards 2500.GOLD (SPOT) – fundamental overview
The yellow metal continues to be well supported on dips with solid demand from medium and longer-term accounts. These players are more concerned about inflation risk and a less upbeat global growth outlook. All of this should keep the commodity well supported, with many market participants also fleeing to the hard asset as the grand dichotomy of record high equities and record low yields comes to an end.