


Special report: US jobs report preview and market impact
Today’s report: Counterintuitive price action
Currency and equity markets are finally back in sync into Thursday, though at the same time, they appear to be in sync but also moving in a counterintuitive direction. Everything we’ve seen of late has been supporting the case for less rate cuts than more in 2024.
Wake-up call
- June ECB
- USD selling
- cautious behavior
- AUDUSD Copper gains give Aussie a nice boost
- PMI data
- Sentiment uptick
- easy policy
- Macro themes
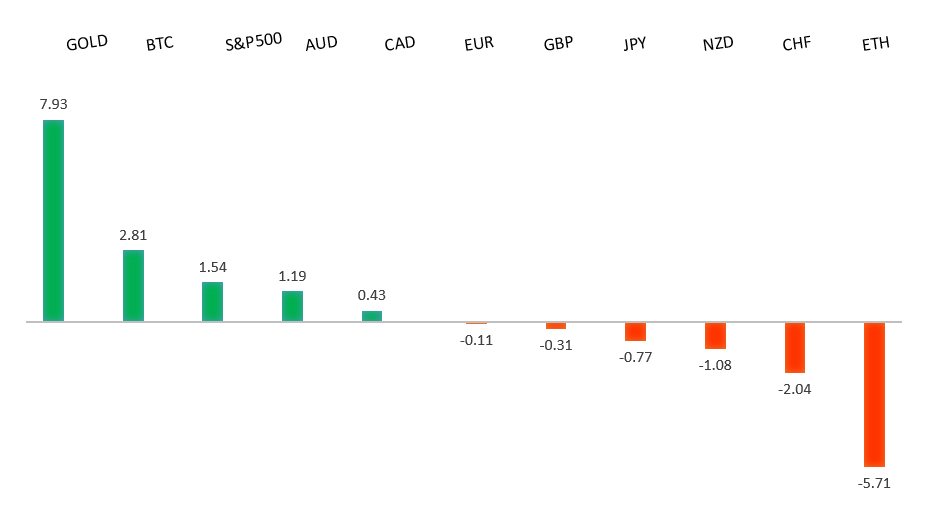
Peformance chart: 30-Day Performance vs. US dollar (%)
Suggested reading
- Recycling Could Play Key Role in Energy Transition, T. Wilson, Financial Times (April 4, 2024)
- On the Matter of Rate Cuts, Not So Fast, A. Yang, Deutsche Bank (April 4, 2024)
Chart talk: Technical & fundamental highlights
Choose pair:
EURUSD – technical overview
The Euro has been in a multi-month consolidation since bottoming out in 2022. Setbacks have since been exceptionally well supported on dips below 1.0500, with a higher platform sought out ahead of the next major upside extension. Look for a push through the 2023 high at 1.1276 to strengthen the constructive outlook and extend the recovery run towards 1.2000. Only back below 1.0400 negates.EURUSD – fundamental overview
The fact that a June rate cut at the ECB has now been fully priced in is leaving room for the market to sell the fact, which means Euro downside has been accounted for, leaving the currency in position to rally back to the topside. We've also been seeing a wave of broad based US Dollar selling this week, which has also helped to prop the single currency. Key standouts on Thursday’s calendar come from German, Eurozone, and UK services PMIs, Eurozone producer prices, the ECB Minutes, Canada trade, US trade, US initial jobless claims, and some Fed speak.EURUSD - Technical charts in detail
GBPUSD – technical overview
Signs have emerged of the market wanting to put in a longer-term base after collapsing to a record low in September 2022. The latest push to a fresh 2024 high beyond 1.2830 confirms the outlook and opens the door for the next major upside extension towards the 2023 high at 1.3143. Any setbacks should now be well supported ahead of 1.2500.GBPUSD – fundamental overview
All of this latest recovery in the Pound has been about renewed downside pressure on the US Dollar. There have been no meaningful updates out of the UK over the past 24 hours. Key standouts on Thursday’s calendar come from German, Eurozone, and UK services PMIs, Eurozone producer prices, the ECB Minutes, Canada trade, US trade, US initial jobless claims, and some Fed speak.USDJPY – technical overview
The market remains confined to a strong uptrend, with sights set on a retest and break of the multi-year high from 2022 at 151.95. A push through this level will open the next major upside extension towards 155.00. Key support comes in at 146.48, with only a weekly close below to delay the constructive outlook.USDJPY – fundamental overview
The Yen has entered a period of tight consolidation with bears a little more cautious about testing the BOJ's resolve, and bulls not able to produce a convincing enough case to be wanting to buy. Key standouts on Thursday’s calendar come from German, Eurozone, and UK services PMIs, Eurozone producer prices, the ECB Minutes, Canada trade, US trade, US initial jobless claims, and some Fed speak.AUDUSD – technical overview
There are signs of the potential formation of a longer-term base with the market trading down into a meaningful longer-term support zone. Only a monthly close below 0.6200 would give reason for rethink. Back above 0.6900 will take the big picture pressure off the downside and strengthen case for a bottom.AUDUSD – fundamental overview
Mixed data out of Australia on Thursday, though this hasn't stopped the Australian Dollar from rallying. The currency is getting a boost from a big run in the price of copper, along with a rebound in US equities. Key standouts on Thursday’s calendar come from German, Eurozone, and UK services PMIs, Eurozone producer prices, the ECB Minutes, Canada trade, US trade, US initial jobless claims, and some Fed speak.USDCAD – technical overview
Above 1.3000 signals an end to a period of longer-term bearish consolidation and suggests the market is in the process of carving out a more significant longer-term base. Next key resistance now comes in up into the 1.4000 area. Setbacks should be very well supported down into the 1.3000 area.USDCAD – fundamental overview
The Canadian Dollar is higher against the US Dollar on the broad based US Dollar selling, surging commodities prices, and recovery in US equities, but has also been held back a bit after Canada services PMI readings came in on the softer side. Key standouts on Thursday’s calendar come from German, Eurozone, and UK services PMIs, Eurozone producer prices, the ECB Minutes, Canada trade, US trade, US initial jobless claims, and some Fed speak.NZDUSD – technical overview
Overall pressure remains on the downside with the market continuing to stall out on runs up into the 0.6500 area. At the same time, there are some signs of the market wanting to put in a longer-term base. Ultimately, a break back above 0.6500 would be required to take the medium-term pressure off the downside and encourage this prospect. A monthly close below 0.5800 will intensify bearish price action.NZDUSD – fundamental overview
The New Zealand Dollar has shrugged off any concerns about a more downbeat RBNZ at next week's meeting, instead focusing on surging commodities prices and a recovery in US equities. Key standouts on Thursday’s calendar come from German, Eurozone, and UK services PMIs, Eurozone producer prices, the ECB Minutes, Canada trade, US trade, US initial jobless claims, and some Fed speak.US SPX 500 – technical overview
Longer-term technical studies continue to look quite extended after pushing to fresh record highs, begging for a deeper correction ahead. Look for rallies to be well capped in favor of lower tops and lower lows. Next key support comes in at 5110.US SPX 500 – fundamental overview
Though we have seen an adjustment of investor expectations towards the amount of rate cuts in 2024, the market still believes policy will end up erring more towards the investor friendly, accommodative side of things. This bet has kept stocks well bid and pushing record highs. Still, it's important to highlight the fact that the Fed has yet to declare a victory over inflation and could disappoint investors with less accommodative policy than desired going forward. If this happens, stocks could be in for a nasty bearish reversal.GOLD (SPOT) – technical overview
The 2019 breakout above the 2016 high at 1375 was a significant development, opening the door for fresh record highs. Setbacks should now be well supported above 1900 on a monthly close basis ahead of the next major upside extension towards 2500.GOLD (SPOT) – fundamental overview
The yellow metal continues to be well supported on dips with solid demand from medium and longer-term accounts. These players are more concerned about inflation risk and a less upbeat global growth outlook. All of this should keep the commodity well supported, with many market participants also fleeing to the hard asset as the grand dichotomy of record high equities and record low yields comes to an end.