


Next 24 hours: US producer prices take spotlight over ECB decision
Today’s report: About US CPI fallout, producer prices, and bitcoin
US rate expectations have seen another wild repricing in the aftermath of this latest hot US CPI print. The market is now looking for just 42 basis points of cuts in 2024, almost another full basis point of a cut since only last Friday.
Wake-up call
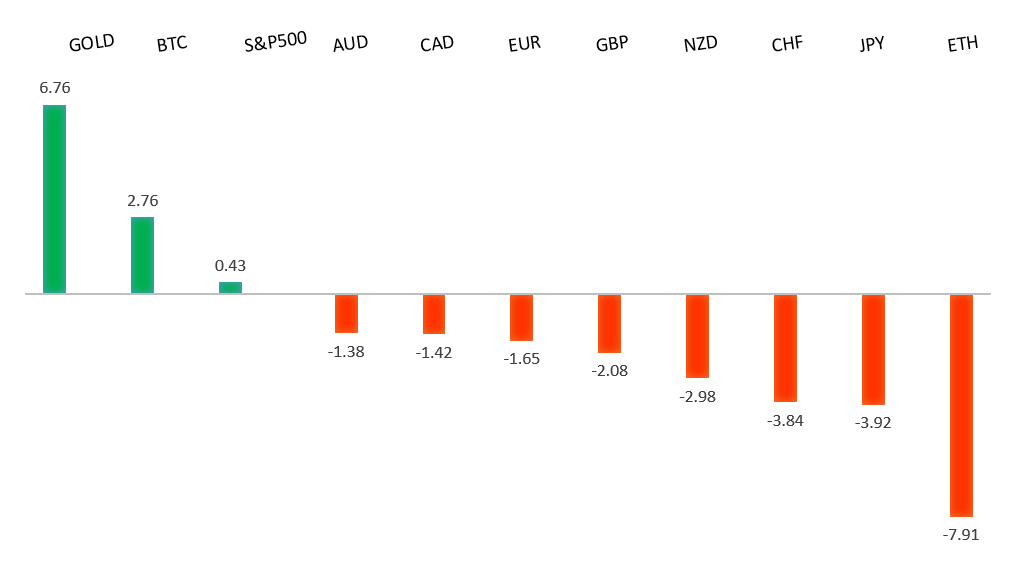
Peformance chart: 30-Day Performance vs. US dollar (%)
Suggested reading
- The Fed Must Choose Its Poison, D. Lachman, AEIdeas (April 7, 2024)
- Cash And Carry, J. Calhoun, Alhambra (April 9, 2024)
Chart talk: Technical & fundamental highlights
Choose pair:
EURUSD – technical overview
The Euro has been in a multi-month consolidation since bottoming out in 2022. Setbacks have since been exceptionally well supported on dips below 1.0500, with a higher platform sought out ahead of the next major upside extension. Look for a push through the 2023 high at 1.1276 to strengthen the constructive outlook and extend the recovery run towards 1.2000. Only back below 1.0400 negates.EURUSD – fundamental overview
The Euro is under pressure into Thursday after the US CPI data came out on the hotter side of expectation. Key standouts on Thursday’s calendar come from the ECB policy decision, US initial jobless claims, and US producer prices.EURUSD - Technical charts in detail
GBPUSD – technical overview
Signs have emerged of the market wanting to put in a longer-term base after collapsing to a record low in September 2022. The latest push to a fresh 2024 high beyond 1.2830 confirms the outlook and opens the door for the next major upside extension towards the 2023 high at 1.3143. Any setbacks should now be well supported ahead of 1.2500.GBPUSD – fundamental overview
Latest price action has been all about the US side of the equation, with the Pound under intense pressure after US CPI data came in hotter than expected on Wednesday. Key standouts on Thursday’s calendar come from the ECB policy decision, US initial jobless claims, and US producer prices.USDJPY – technical overview
The market remains confined to a strong uptrend, most recently pushing through the multi-year high from 2022 at 151.95. This now opens the next major upside extension towards 155.00. Key support comes in at 150.00, with only a weekly close below to delay the constructive outlook.USDJPY – fundamental overview
There wasn't too much worry around the threat of Japanese intervention in the Yen on Wednesday. The Yen has slid to a 34 year low against the Buck after US inflation data came in hotter than expected. The chatter making the rounds now is that there won't be any intervention until USDJPY 155.00. Key standouts on Thursday’s calendar come from the ECB policy decision, US initial jobless claims, and US producer prices.AUDUSD – technical overview
There are signs of the potential formation of a longer-term base with the market trading down into a meaningful longer-term support zone. Only a monthly close below 0.6200 would give reason for rethink. Back above 0.6900 will take the big picture pressure off the downside and strengthen case for a bottom.AUDUSD – fundamental overview
The latest slide in the Australian Dollar has everything to do with yield differentials moving to the US Dollar after US CPI came in hot on Thursday. Key standouts on Thursday’s calendar come from the ECB policy decision, US initial jobless claims, and US producer prices.USDCAD – technical overview
Above 1.3000 signals an end to a period of longer-term bearish consolidation and suggests the market is in the process of carving out a more significant longer-term base. Next key resistance now comes in up into the 1.4000 area. Setbacks should be very well supported down into the 1.3000 area.USDCAD – fundamental overview
The Bank of Canada left rates on hold as widely expected, while Bank of Canada Macklem said a June rate cut was on the table. The market is now pricing a greater than 50% chance for a June BoC cut. Canada housing data came in better than expected as well, which helped to offset some of the weakness in the Canadian Dollar from the bigger event of the day, which was broad based Dollar demand on a hot US CPI number. The Canadian Dollar wasn't able to avoid trading to a fresh yearly low against the Buck on this news. Key standouts on Thursday’s calendar come from the ECB policy decision, US initial jobless claims, and US producer prices.NZDUSD – technical overview
Overall pressure remains on the downside with the market continuing to stall out on runs up into the 0.6500 area. At the same time, there are some signs of the market wanting to put in a longer-term base. Ultimately, a break back above 0.6500 would be required to take the medium-term pressure off the downside and encourage this prospect. A monthly close below 0.5800 will intensify bearish price action.NZDUSD – fundamental overview
The latest slide in the New Zealand Dollar has everything to do with yield differentials moving to the US Dollar after US CPI came in hot on Thursday. Key standouts on Thursday’s calendar come from the ECB policy decision, US initial jobless claims, and US producer prices.US SPX 500 – technical overview
Longer-term technical studies continue to look quite extended after pushing to fresh record highs, begging for a deeper correction ahead. Look for rallies to be well capped in favor of lower tops and lower lows. Next key support comes in at 5110.US SPX 500 – fundamental overview
Though we have seen an adjustment of investor expectations towards the amount of rate cuts in 2024, the market still believes policy will end up erring more towards the investor friendly, accommodative side of things. This bet has kept stocks well bid and pushing record highs. Still, it's important to highlight the fact that the Fed has yet to declare a victory over inflation and could disappoint investors with less accommodative policy than desired going forward. If this happens, stocks could be in for a nasty bearish reversal.GOLD (SPOT) – technical overview
The 2019 breakout above the 2016 high at 1375 was a significant development, opening the door for fresh record highs. Setbacks should now be well supported above 1900 on a monthly close basis ahead of the next major upside extension towards 2500.GOLD (SPOT) – fundamental overview
The yellow metal continues to be well supported on dips with solid demand from medium and longer-term accounts. These players are more concerned about inflation risk and a less upbeat global growth outlook. All of this should keep the commodity well supported, with many market participants also fleeing to the hard asset as the grand dichotomy of record high equities and record low yields comes to an end.