


Next 24 hours: Why the US Dollar is lower on Wednesday
Today’s report: Powell's message rattles markets
We’ve seen some profit taking on Dollar longs into Wednesday, but overall, the US Dollar remains well in demand, especially after the Fed Chair came out with his comments on Tuesday. Jerome Powell signaled the central bank would likely keep rates on hold for longer on account of an ongoing battle with inflation.
Wake-up call
- ZEW reads
- average earnings
- Kazuo Momma
- leading index
- cut odds
- inflation data
- next excuse
- Macro themes
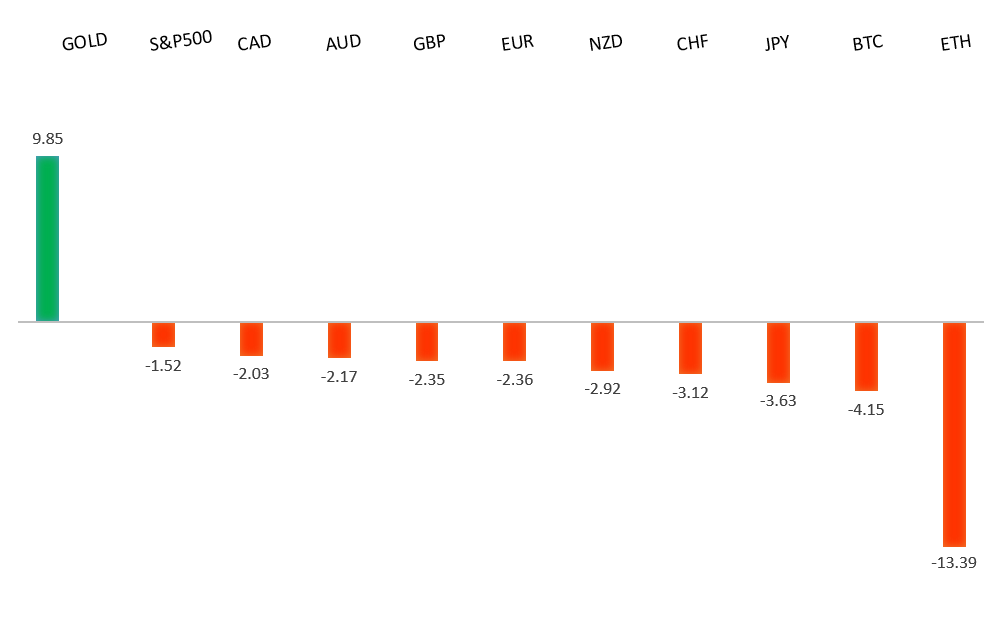
Peformance chart: 30-Day Performance vs. US dollar (%)
Suggested reading
- Why Rate Cuts From Federal Reserve Would Be Unwise, P, Morici, MarketWatch (April 16, 2024)
- Investing Wisdom from Blackstone's Stephen Schwarzman, S. Klebnikov, Forbes (April 13, 2024)
Chart talk: Technical & fundamental highlights
Choose pair:
EURUSD – technical overview
The Euro has been in a multi-month consolidation since bottoming out in 2022. Setbacks have since been exceptionally well supported on dips below 1.0500, with a higher platform sought out ahead of the next major upside extension. Look for a push through the 2023 high at 1.1276 to strengthen the constructive outlook and extend the recovery run towards 1.2000. Only back below 1.0400 negates.EURUSD – fundamental overview
The Euro has managed to steady itself into the mid-week, mostly on the back of Tuesday's well received German and Eurozone ZEW reads. Key standouts on Wednesday’s calendar come from UK inflation, Eurozone inflation, the Fed Beige Book, and central bank speak from BOE and Fed officials.EURUSD - Technical charts in detail
GBPUSD – technical overview
Signs have emerged of the market wanting to put in a longer-term base after collapsing to a record low in September 2022. The latest push to a fresh 2024 high beyond 1.2830 confirms the outlook and opens the door for the next major upside extension towards the 2023 high at 1.3143. Any setbacks should now be well supported ahead of 1.2000.GBPUSD – fundamental overview
Although the UK unemployment rate was on the rise, the fact that average earnings ticked up by more than expected, was enough to keep the market in the direction of pricing a more hawkish leaning BOE, which opened demand for the Pound. Key standouts on Wednesday’s calendar come from UK inflation, Eurozone inflation, the Fed Beige Book, and central bank speak from BOE and Fed officials.USDJPY – technical overview
The market remains confined to a strong uptrend, most recently pushing through the multi-year high from 2022 at 151.95. This now opens the next major upside extension towards 155.00. Key support comes in at 150.00, with only a weekly close below to delay the constructive outlook.USDJPY – fundamental overview
Former Executive Director in charge of monetary policy Kazuo Momma was on the wires earlier today saying the BOJ would likely hike rates by 0.25% at the September meeting. Momma said persistent weakness in the Yen introduced upside risks to inflation which should pressure BOJ Governor Ueda into a less dovish stance. On the data front, Japan exports came in stronger than expected. Key standouts on Wednesday’s calendar come from UK inflation, Eurozone inflation, the Fed Beige Book, and central bank speak from BOE and Fed officials.AUDUSD – technical overview
There are signs of the potential formation of a longer-term base with the market trading down into a meaningful longer-term support zone. Only a monthly close below 0.6200 would give reason for rethink. Back above 0.6900 will take the big picture pressure off the downside and strengthen case for a bottom.AUDUSD – fundamental overview
The Australian Dollar is trying to recover from yearly lows on Wednesday, mostly on the back of across the board profit taking on US Dollar longs. Earlier today, Westpac released its Leading Index, showing the growth rate dropping further into the red, suggesting the economy's sub-trend growth performance will continue in 2024. Key standouts on Wednesday’s calendar come from UK inflation, Eurozone inflation, the Fed Beige Book, and central bank speak from BOE and Fed officials.USDCAD – technical overview
Above 1.3000 signals an end to a period of longer-term bearish consolidation and suggests the market is in the process of carving out a more significant longer-term base. Next key resistance now comes in up into the 1.4000 area. Setbacks should be very well supported down into the 1.3000 area.USDCAD – fundamental overview
The Canadian Dollar took another hit on Tuesday, extending its run of yearly lows against the Buck after Canada core CPI cooled down. This was the slowest print since July of 2021 and odds for a June Bank of Canada rate cut have risen to about 75%. Key standouts on Wednesday’s calendar come from UK inflation, Eurozone inflation, the Fed Beige Book, and central bank speak from BOE and Fed officials.NZDUSD – technical overview
Overall pressure remains on the downside with the market continuing to stall out on runs up into the 0.6500 area. At the same time, there are some signs of the market wanting to put in a longer-term base. Ultimately, a break back above 0.6500 would be required to take the medium-term pressure off the downside and encourage this prospect. A monthly close below 0.5800 will intensify bearish price action.NZDUSD – fundamental overview
There wasn't much surprise from the latest New Zealand inflation data, though the market has taken what it wants and is using it as an opportunity to rally the New Zealand Dollar. Though the headline Q1 CPI print was the lowest since the second quarter of 2021, it was still comfortably above the RBNZ's target band, while also exceeding previous forecasts. The higher than expected non-tradeable component was also a head turner that translated to Kiwi demand. Key standouts on Wednesday’s calendar come from UK inflation, Eurozone inflation, the Fed Beige Book, and central bank speak from BOE and Fed officials.US SPX 500 – technical overview
Longer-term technical studies continue to look quite extended after pushing to fresh record highs, begging for a deeper correction ahead. Look for rallies to be well capped in favor of lower tops and lower lows. Next key support comes in at 4921.US SPX 500 – fundamental overview
Though we have seen an adjustment of investor expectations towards the amount of rate cuts in 2024, the market still hopes policy will end up erring more towards the investor friendly, accommodative side of things. This bet has kept stocks well bid into dips and consistently pushing record highs.GOLD (SPOT) – technical overview
The 2019 breakout above the 2016 high at 1375 was a significant development, opening the door for fresh record highs. Setbacks should now be well supported above 1900 on a monthly close basis ahead of the next major upside extension towards 2500.GOLD (SPOT) – fundamental overview
The yellow metal has pushed record highs in 2024 with solid demand from medium and longer-term accounts. These players are more concerned about inflation risk and a less upbeat global growth outlook. All of this should keep the commodity well supported, with many market participants also fleeing to the hard asset as the grand dichotomy of record high equities and record low yields comes to an end.